
[NB: This post is co-authored with Christopher Ketcham. A slightly different version was published earlier today in The Intercept under the headline “What The Coronavirus Pandemic Can Teach Us About The Climate Emergency.”]
Greta Thunberg couldn’t do it. Bill McKibben and 350.org couldn’t do it, and neither could the Paris climate accord. But Covid-19 is cutting human-caused emissions of carbon dioxide and other greenhouse gases as travel and other economic activity in much of the world slow or halt altogether.
While the contraction in CO2 emissions set off by the virus may not be as pronounced as the related though distinct fall in “conventional” pollutants like soot and smog, it is far more consequential. Soot and smog poison and kill only in the present, while greenhouse gases stick around to maim the climate for the next century. Burning a fossil fuel today is tantamount to signing a death warrant for future generations. Conversely, forgoing an action that would have caused a fossil fuel to be burned creates a permanent benefit.
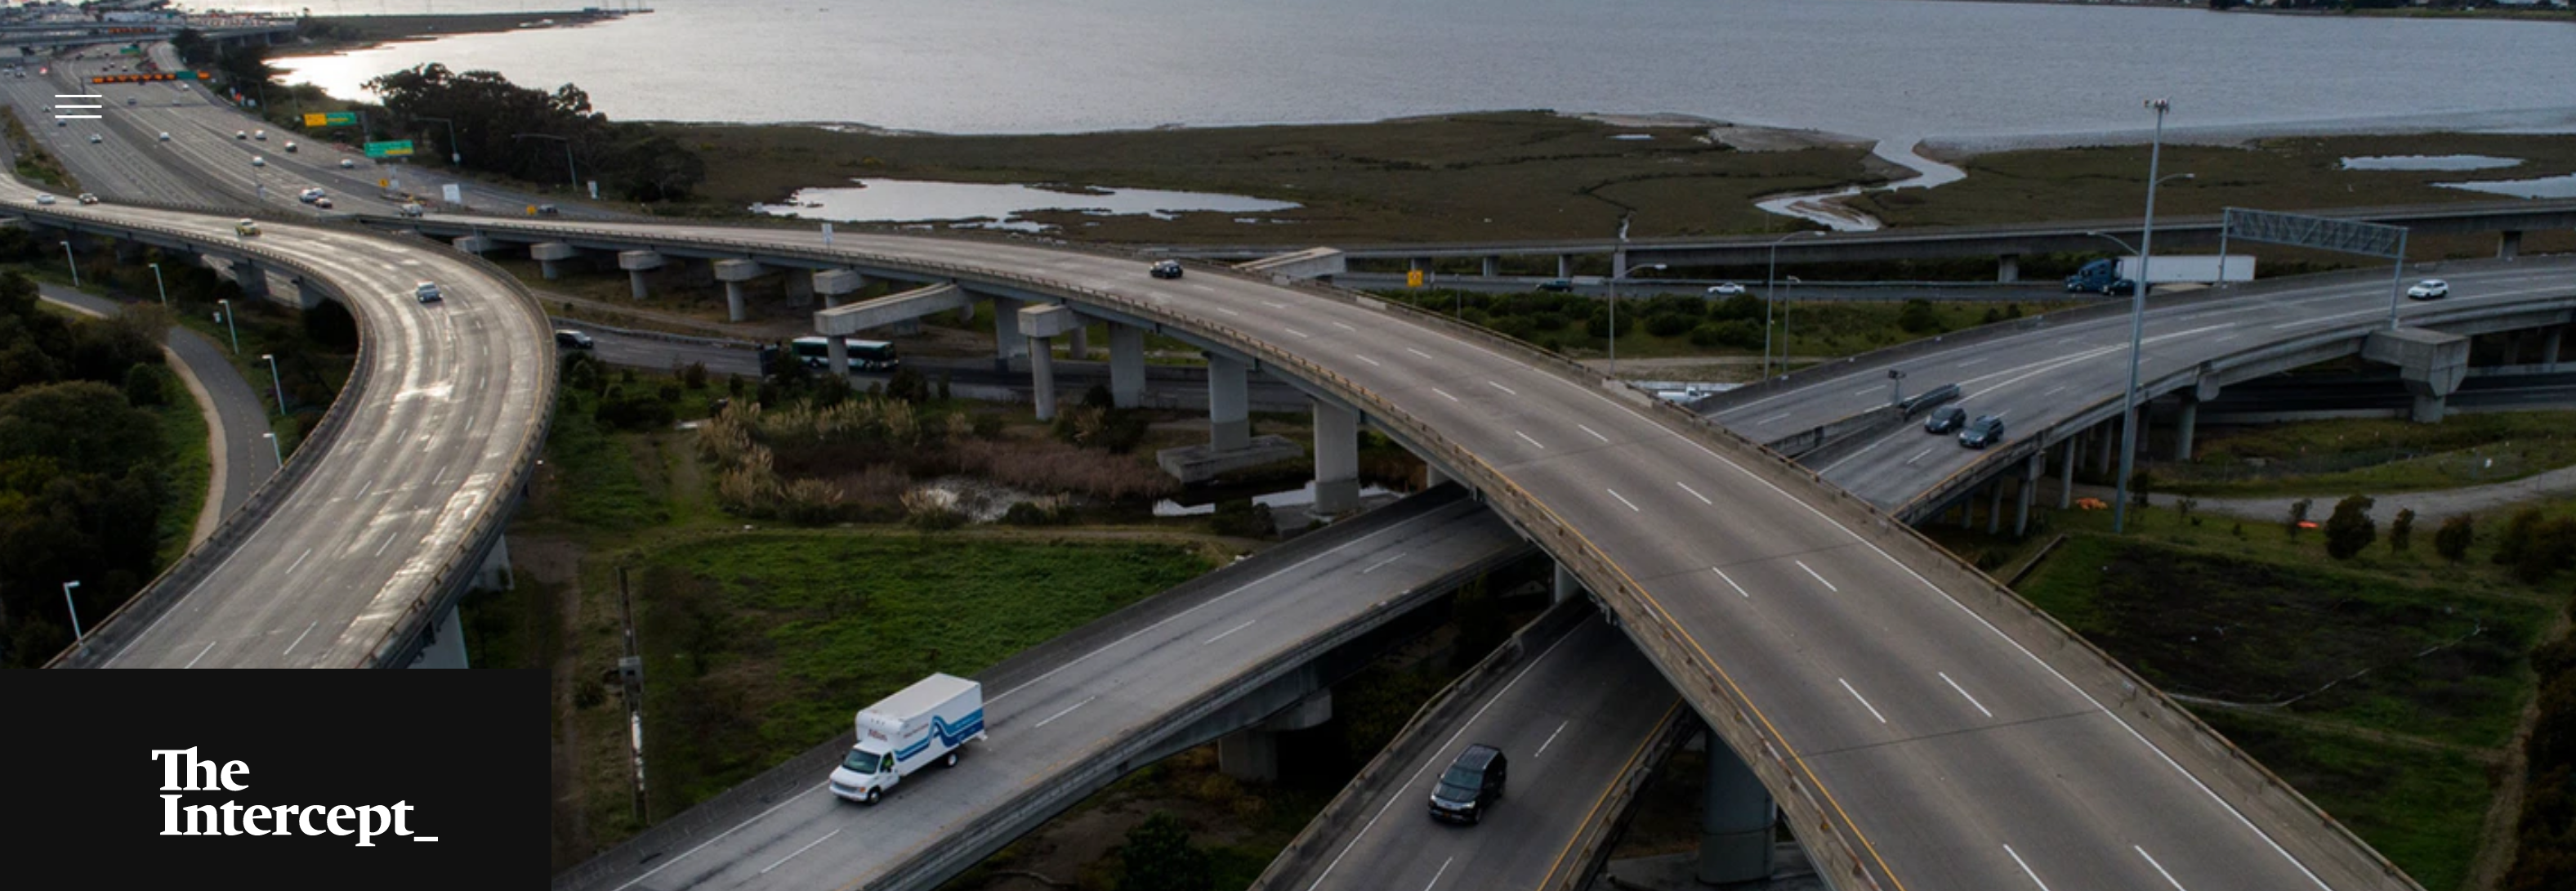
Traffic is unusually light in Oakland, Calif., on the approach to the Bay Bridge on March 17, 2020, after seven Bay Area counties are locked down in an unprecedented shelter-in-place order. Photo: Jane Tyska/Digital First Media/East Bay Times via Getty Images. (Originally published in The Intercept’s April 4 version of this post.)
Until now, the only downturn of note in total worldwide CO2 emissions during the era of climate awareness — defined as the period beginning in 1995 with the first U.N. Climate Change Conference — was in 2009, the onset of the Great Recession. That downturn was brief and mild.
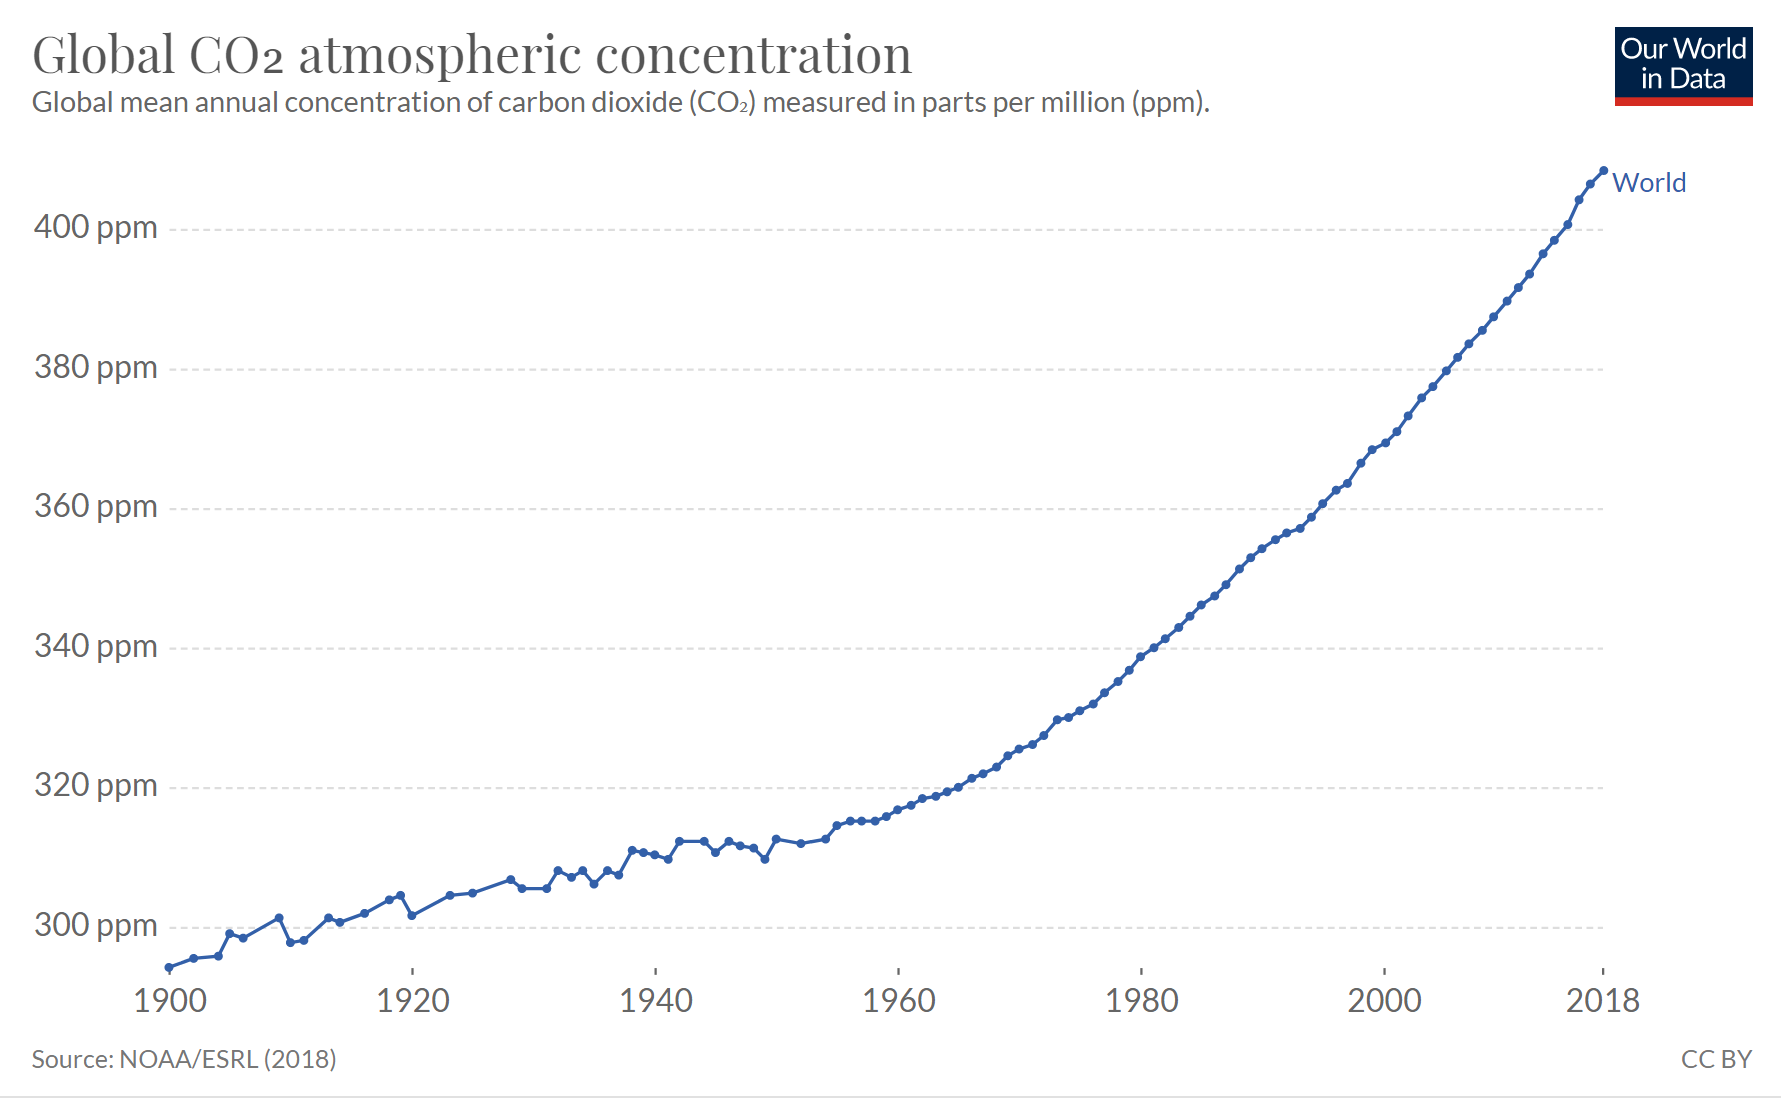
In contrast, the current contraction could be severe enough to cut in half this year’s addition to the atmosphere’s carbon dioxide concentration — the metric that dictates climate change — according to calculations by co-author Charles Komanoff for the Carbon Tax Center.
Is it cruel to point approvingly to the steep reduction in carbon emissions now unfolding, given the skyrocketing deaths, lost livelihoods, and widespread privation? And won’t the reductions be negated as the virus is tamed and emissions come roaring back? No and no.
Like so much else, whether or not the current reduction in CO2 is sustained will depend on who gets to reconstruct society after the virus. But the reduction will not be negated. Just as carbon emissions persist long enough in Earth’s upper atmosphere to act as permanent climate change agents in terms of one individual’s lifetime, avoided emissions are a permanent balm.
The airplane trips you won’t take this year won’t be made up in 2021, for the simple reason that most people who use airplanes do so regularly. A missed trip isn’t a once-in-a-lifetime experience that will be put back next year; it’s a missed trip, period. Ditto for work commutes and leisure activities.
So yes, the precipitous drop in burning petrol for vehicles and aircraft has a lasting imprint. The contraction of the U.S. economy this year could purge 30 to 40 percent of carbon emissions we would otherwise spew. Similar but milder jettisoning of carbon-burning in the rest of the world could collectively trim up to one part per million from the atmosphere’s present 415 ppm concentration of CO2 — a modest climate-protective achievement, to be sure, but one without precedent in the modern era.
The suffering is a different story. Were a happiness/misery calculator able to quantify the pluses and minuses to well-being from events befalling human society, the coronavirus’s flattening of the rising CO2-in-the-atmosphere curve would obviously be swamped by the lost life and the disordering of business as usual.
And yet business as usual must come to an end if we are to hand down a livable planet to our children.
The rub is how to slash carbon emissions with minimum suffering and maximum social and economic justice, and without nature forcing the reductions on us via pandemics or other chaotic black swan events that are surely in store.
The fact that human behavior and activity are undergoing climate-beneficial changes in the crucible of Covid-19 suggests that “business as usual” can be altered, and quickly. Though we can’t yet point to new models of planned and equitable carbon reduction, there are four identifiable pandemic-driven upheavals of social consciousness that should give us hope of instituting the transformations necessary for civilization not to commit collective climate suicide.
One is that science’s prestige and value are being restored. Americans watching Trump’s circus-like coronavirus daily briefings see National Institutes of Health immunologist Dr. Anthony Fauci stepping in to correct the president’s dangerously ignorant commentary. Similarly, we know it is the community of front-line doctors, nurses, and health care workers who will care for the sick; the epidemiologists and science journalists who will inform the public’s response; and trained chemists, biologists, and statisticians who will synthesize and prove the vaccines that will bring the pandemic to an end. As environmental legal scholar Michael Gerrard wrote last week, the climate change lessons of Covid-19 are to heed the warnings of scientists, do everything possible to minimize the hazards they predict, and prepare to cope with the impacts that remain.
Second, the crisis is helping us see just how much our well-being depends on muscular, proactive governance. Government of the people and for the people is literally the thing that’s now needed more than ever. The people must be sovereign over corporations and not vice versa — a point driven home by the tepid response of big business to Trump’s exhortations to step up manufacture of equipment to protect health care workers.
Third, we may be shaking loose the defeatism that nothing can be done quickly. Take the example of those of us sheltering in place: We are learning, overnight, that simplicity isn’t necessarily austerity, frugality need not be privation, and that we can forgo quite a lot of our leisure and consumer entitlements if it serves some higher purpose — at present, to stop the sickening and death of our fellow human beings; in the longer run, to bend the rising curve of carbon emissions and put a hard stop on climate chaos.
Moreover, if our society can act, finally, to manufacture a million ventilators and a billion protective masks, surely we can within a few years act on a far grander scale to erect, say, a million wind turbines, insulate and solarize a hundred million buildings, carve ribbons of bicycle paths throughout our cities and suburbs, and so on. With the pandemic enforcing a brutal but necessary reset, the NIMBYism that has impeded this kind of progress practically everywhere might be swept into the dustbin for good.
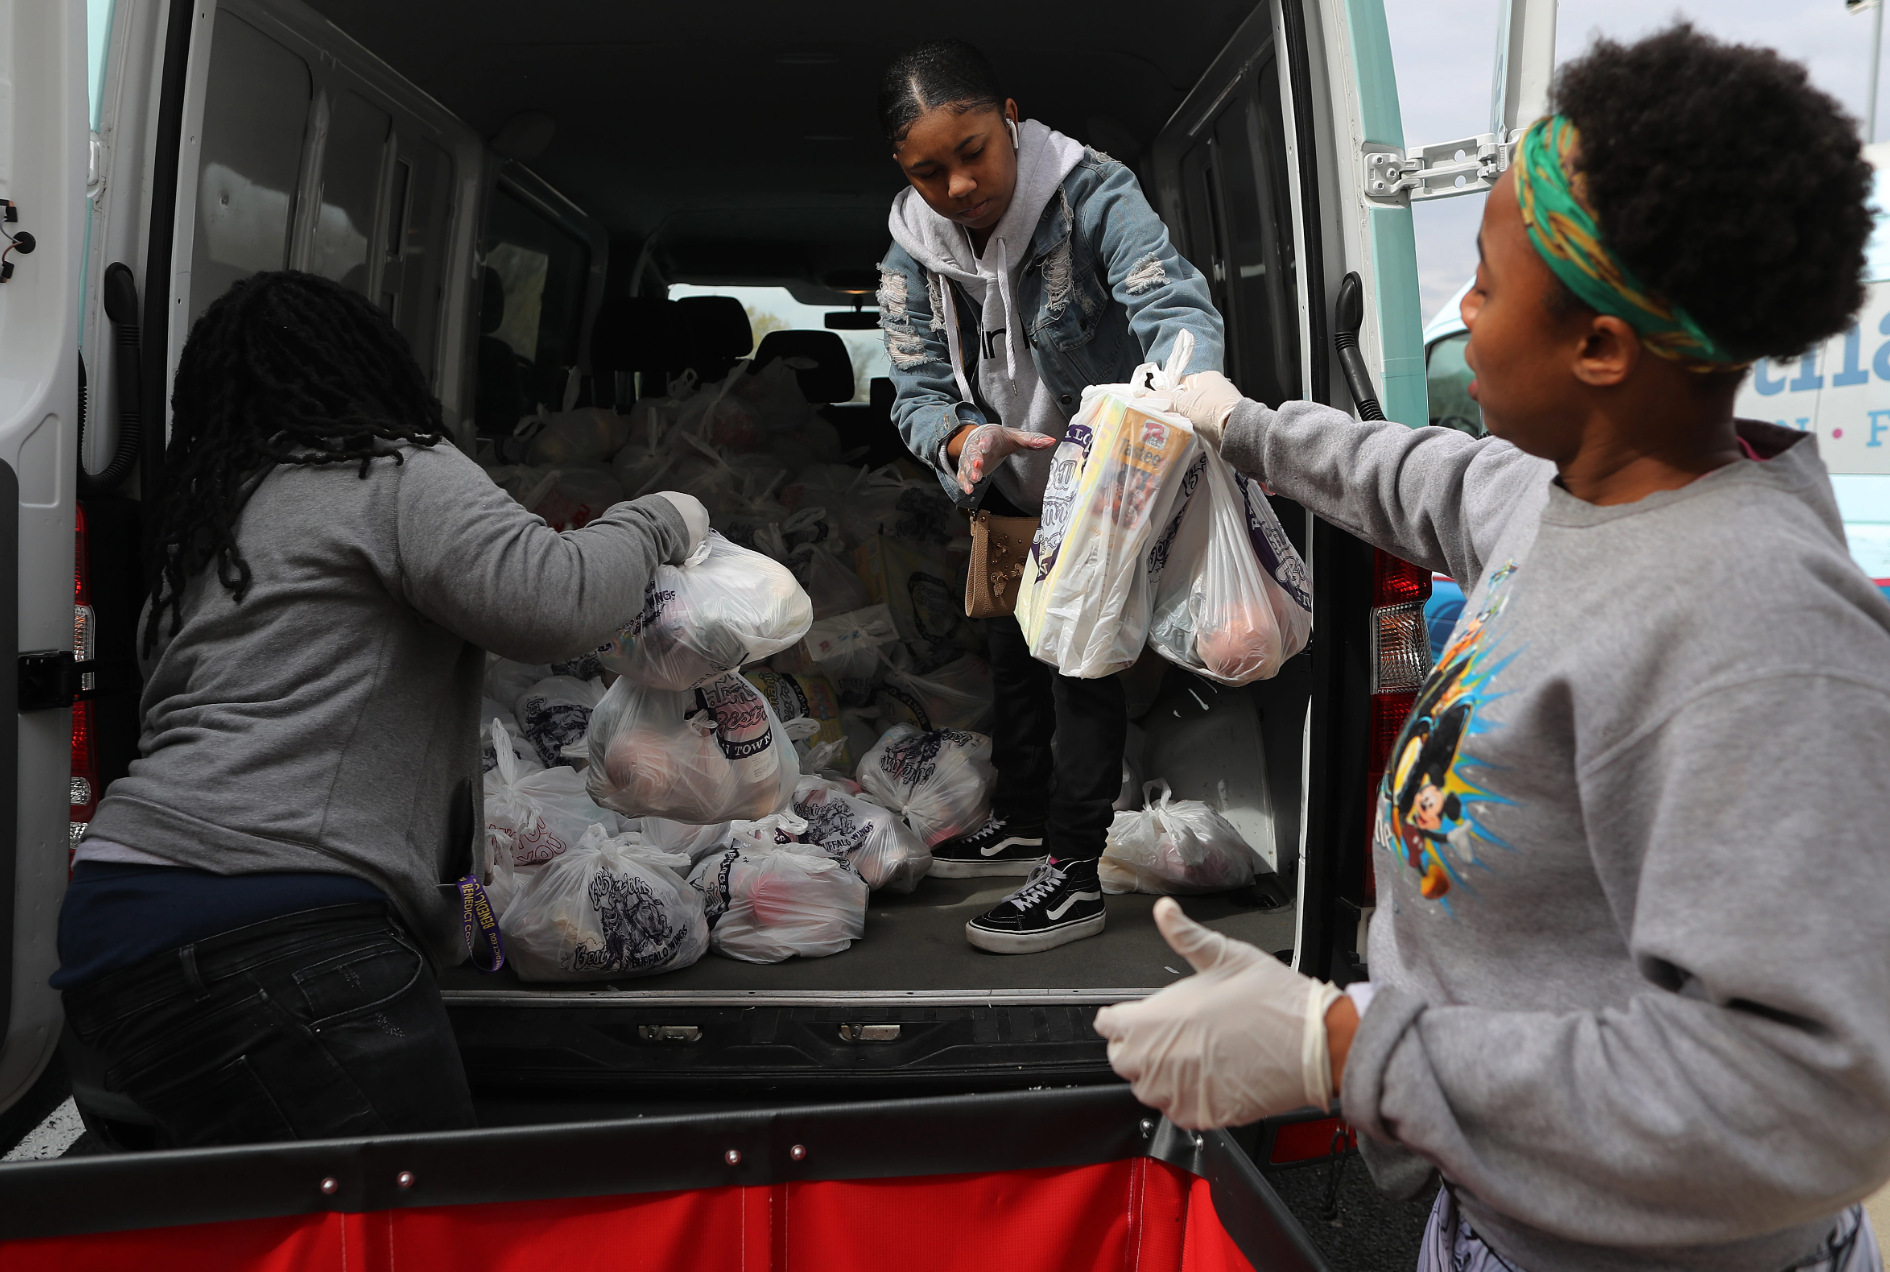
Volunteers for nonprofit organization Martha’s Table load bags of fresh produce to distribute to people in underserved communities on April 1, 2020, amidst the coronavirus pandemic in Washington, D.C. Photo: Chip Somodevilla/Getty Images. (Originally published in The Intercept’s April 4 version of this post.)
Most hearteningly, the crisis is instilling a renewed appreciation of social solidarity. The more we are forced to quarantine and isolate, paradoxically, the more we become cognizant of the need for mutuality and social relations and social conscience. As New York Times columnist Roger Cohen wrote yesterday, “If this plague that cares not a whit for the class or status of its victims cannot teach solidarity over individualistic excess, nothing will.”
My well-being depends on your not being sick. My ability to be fed depends on your ability to grow and transport and distribute food. My life is now literally in your hands, as you make decisions whether to restrain your activity in the public sphere, keep your distance, self-quarantine.
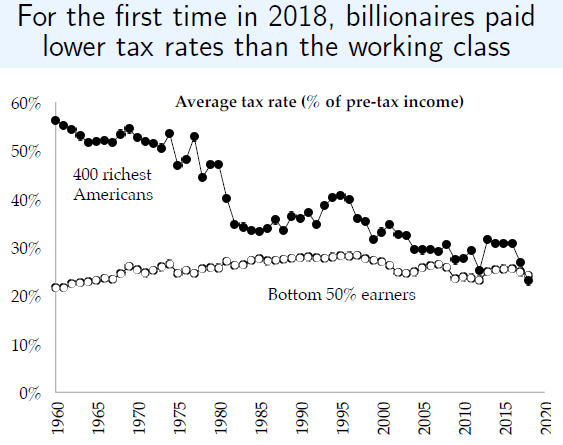
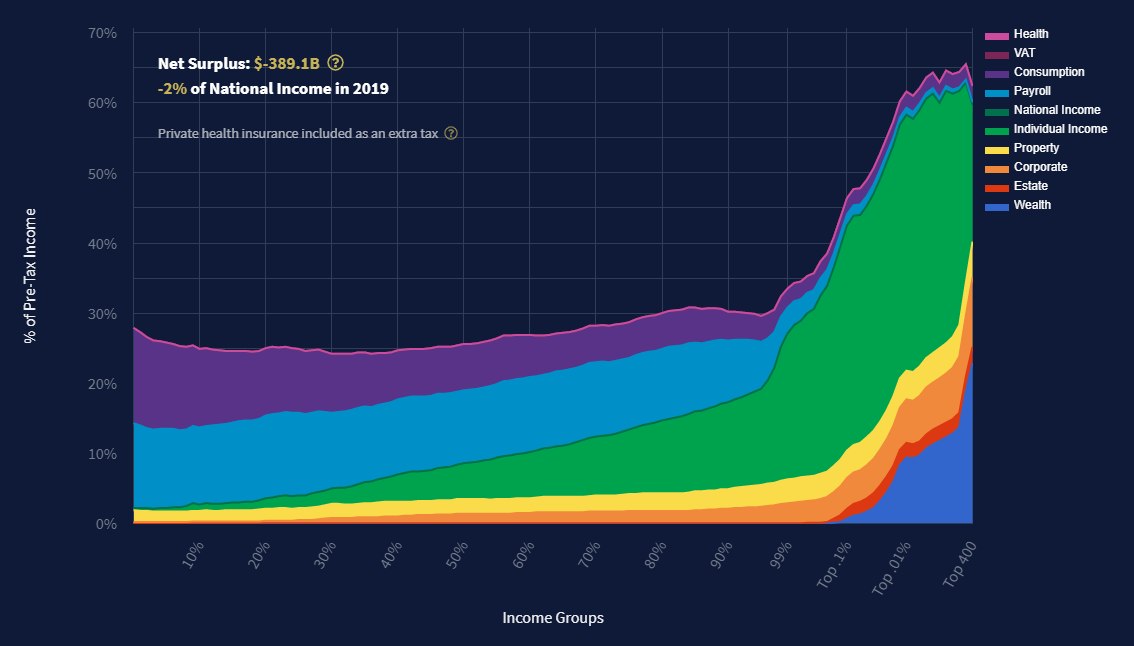
If we so fully need each other, how can I abide your not having affordable health care? In this moment when the precarity of half or more of American households is laid bare, how can I abide a government that places the well-being of billionaires — whose wealth each week generates more money than many of us earn in a lifetime — above that of the 90 percent of Americans who make less than $100,000 a year?
What does solidarity have to do with climate? Everything. People whose health is tenuous and whose pocketbook is empty can’t easily stand up for climate action, but they may do so if government has put them on a solid footing and, in the Green New Deal, provided a framework for paying them good wages to actually implement it.
Synergies abound. With the U.S. government providing direct payments to American households, it’s only a step or two to paying coal miners and cattle ranchers to become solar installers and wind farm maintainers. Enacting some form of guaranteed income, even just temporarily, could pave the way for the “carbon fee and dividend” approach to taxing carbon fuels without further burdening the less well-off. In a different vein, trading frenetic foreign travel for staycations could downsize socially destructive companies like Airbnb, making rental apartments more affordable and in turn diminishing long-distance commuting and slashing carbon footprints.
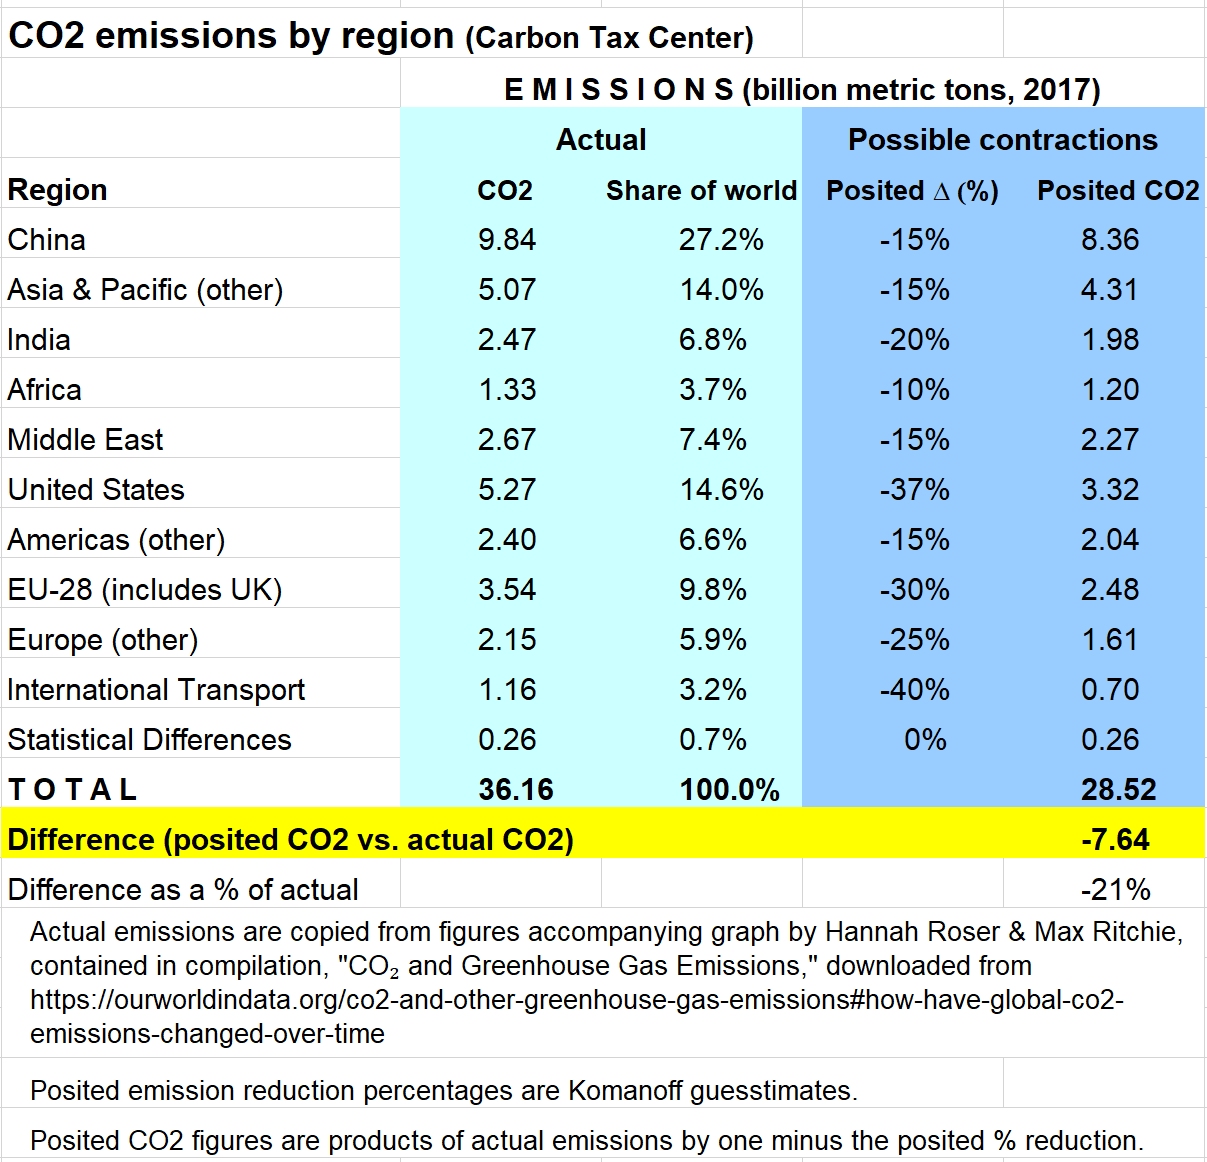
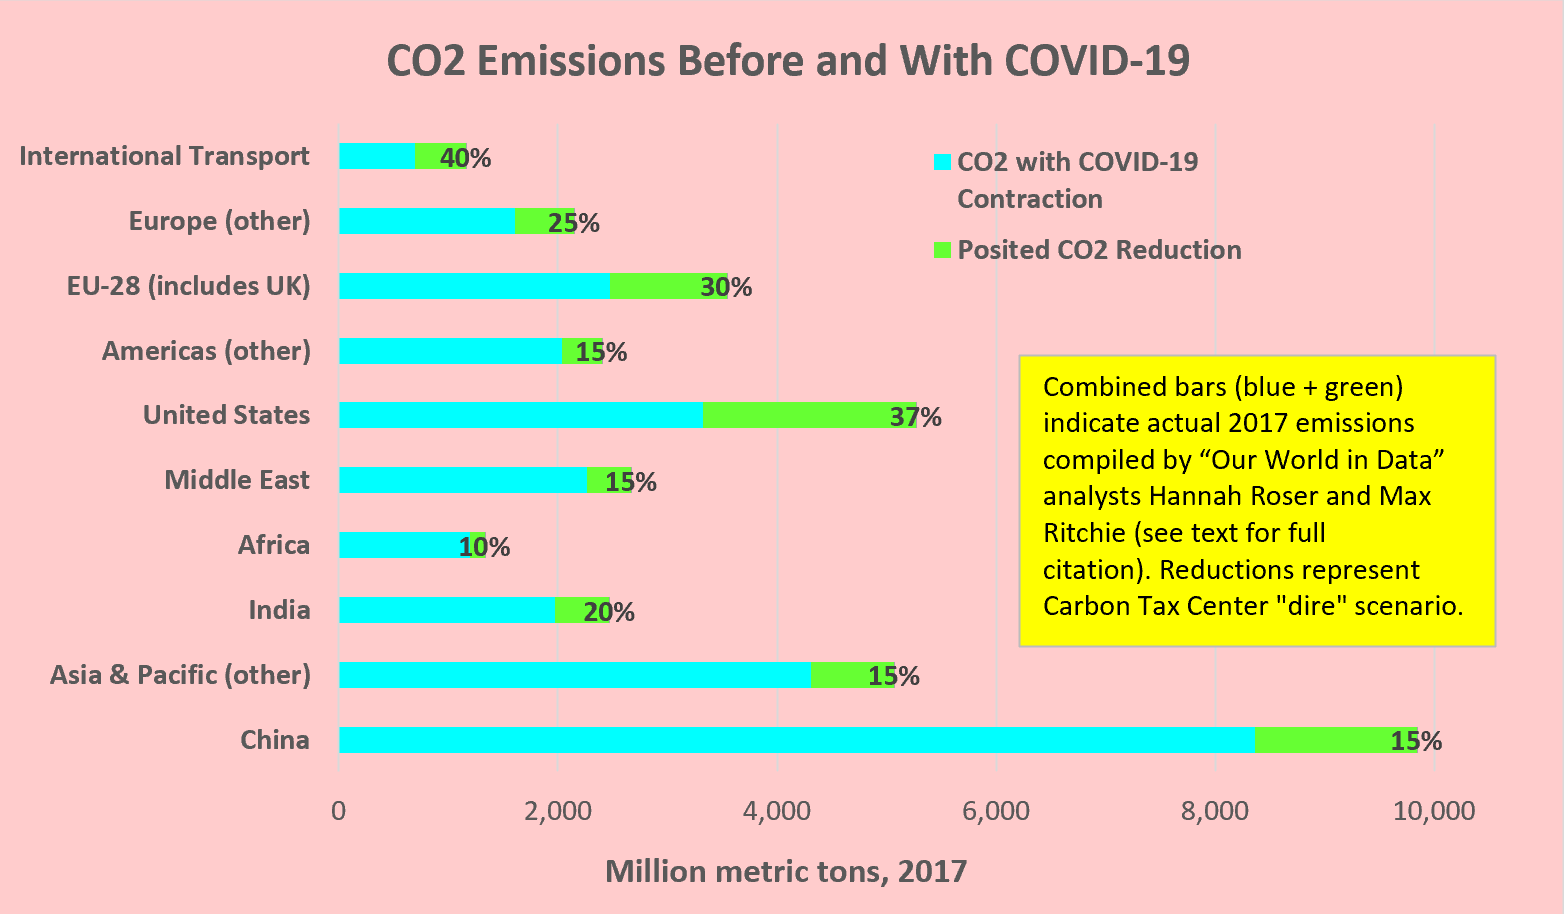
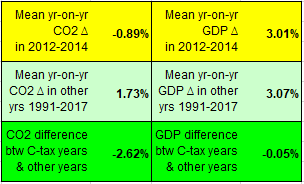
Table shows assumptions supporting Carbon Tax Center assertion that pandemic-caused economic disruptions could shave 1 ppm from atmospheric CO2. See linked CTC post for full discussion.
As for the super-rich, never have their fortunes been so fully revealed as hollow and corrosive. Worldwide, the wealthiest 5 percent of households collectively burn more carbon than the entire bottom half, according to a comprehensive new report from the University of Leeds. Could the past decade’s research and agitation on economic inequality now culminate, in the pandemic’s wake, in an insistence on transmuting extreme private wealth into a new collectively shared wealth of renewable energy and sustainable communities?
Table presents the calculations and assumptions underlying Carbon Tax Center’s assertion that economic disruption from the pandemic could cut 1 ppm from atmospheric CO2. For fuller discussion, follow link from “calculations” higher up in the text.This, more than fossil fuel divestment or class-action litigation, is the kind of program that will actually cast off the yoke of the fossil fuel empire upon which the portfolios of the super-rich depend. In the process, the toxic aspiration to join the super-rich could be swept aside. Bye-bye, lusting after commuter helicopters. Bye-bye, hungering for one’s own island. Bye-bye, legislatures purchased by dark money.
As for those in the rarified upper classes who, in Margaret Thatcher’s iconic phrasing, embrace the libertarian right-wing precept that “there is no such thing as society,” let’s hope they will be answered by the millions of commoners who see clearly, as the pandemic rages, that we are all in this leaky boat together.
Charles Komanoff, a New York City-based economist and activist, directs the Carbon Tax Center. Christopher Ketcham, an upstate New Yorker, is author of “This Land: How Cowboys, Capitalism, and Corruption are Ruining the American West.”
 “Divestment can’t loosen the fossil fuel stranglehold without a carbon tax,” we wrote in a photo caption in