

This page summarizes the status of carbon pricing, worldwide. (For a look at carbon pricing in the United Kingdom, Ireland, Australia, Chile and Sweden, see Where Carbon Is Taxed (Specific Countries). Carbon taxing/pricing in Canada, including British Columbia, has its own page.) The last section of this page shows graphically the world’s 20 largest carbon-emitting countries.
Carbon pricing (a rubric that includes emissions trading systems as well as direct carbon taxing) presents the classic glass half-empty, glass half-full picture.
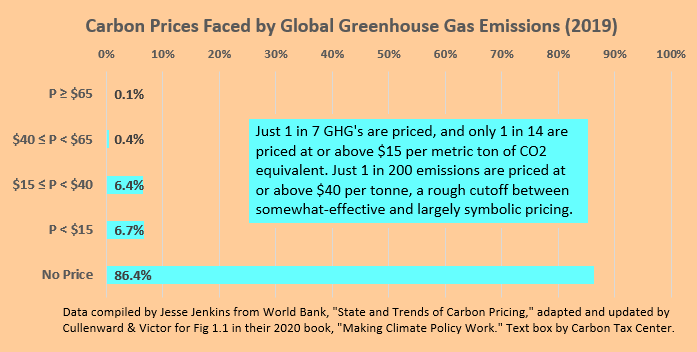
Glass Half-Empty: A dour view of carbon pricing programs
The half-empty glass is represented by the chart at left, below, adapted by Princeton energy modeler-researcher Jesse Jenkins, from World Bank data. It indicates that just 1 in 7 molecularly equivalent greenhouse gases (GHG’s) are priced, with just 1 in 14 priced at or above $15 per metric ton of CO2 equivalent — a largely token level. The stunted top two bars show that just 1 in 200 emission units are priced at or above $40 per tonne, a rough cutoff between somewhat-effective and largely symbolic pricing of carbon dioxide and other greenhouse gases.
Readers are urged to view or download the World Bank’s latest (2020) State and Trends of Carbon Pricing report, for its comprehensive overview on carbon taxes and cap-and-trade systems in place or under consideration around the world, along with national and subnational particulars.
Please also note Carbon Brief’s Paris climate pledge tracker, an on-line spreadsheet that summarized 190 nations’ INDC’s (individual nationally-determined commitments) that constitute the Paris climate agreement. Unfortunately, the data appear frozen in 2015.
Glass Half-Full: An upbeat view of carbon pricing programs
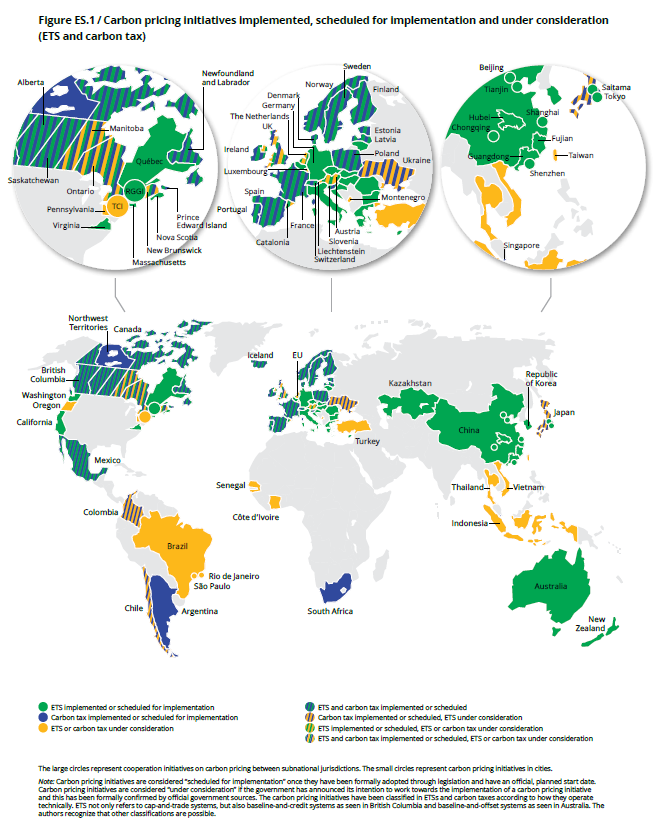
The three graphics directly below, from the World Bank’s 2020 State and Trends report (see link, two paragraphs up), seek to cast actual and prospective carbon pricing programs in an upbeat light:
Figure 1: Summary map of existing, emerging and potential regional, national and subnational carbon pricing initiatives (ETS and tax)
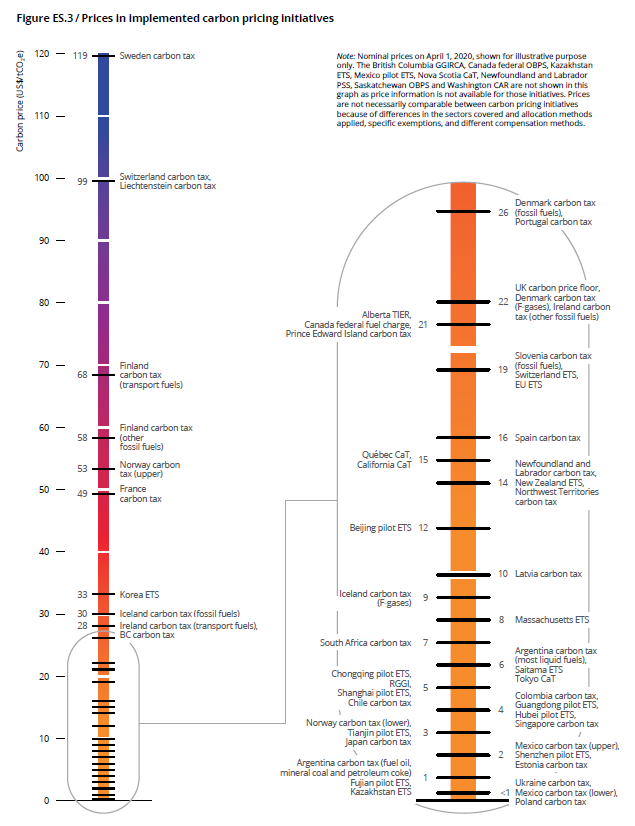
The next World Bank graph shows each program’s carbon price:
Figure 3: Prices in existing carbon pricing initiatives
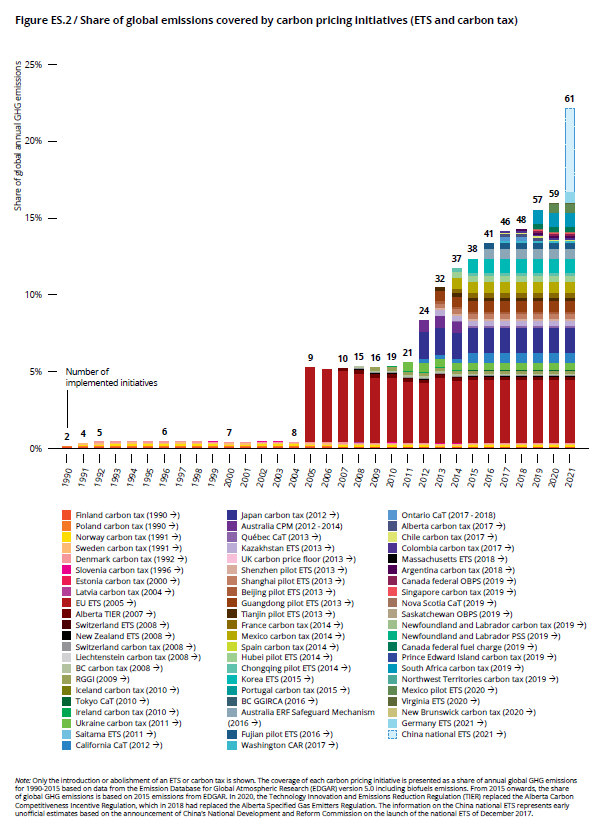
 The third and final World Bank graph ingeniously but perhaps over-optimistically depicts the growing cumulative share of global CO2 emissions “covered” by carbon pricing policies:
Figure 2: Regional, national and subnational carbon pricing initiatives: share of global GHG emissions covered
As noted, there’s rich detail in the World Bank report. Here’s the link again.
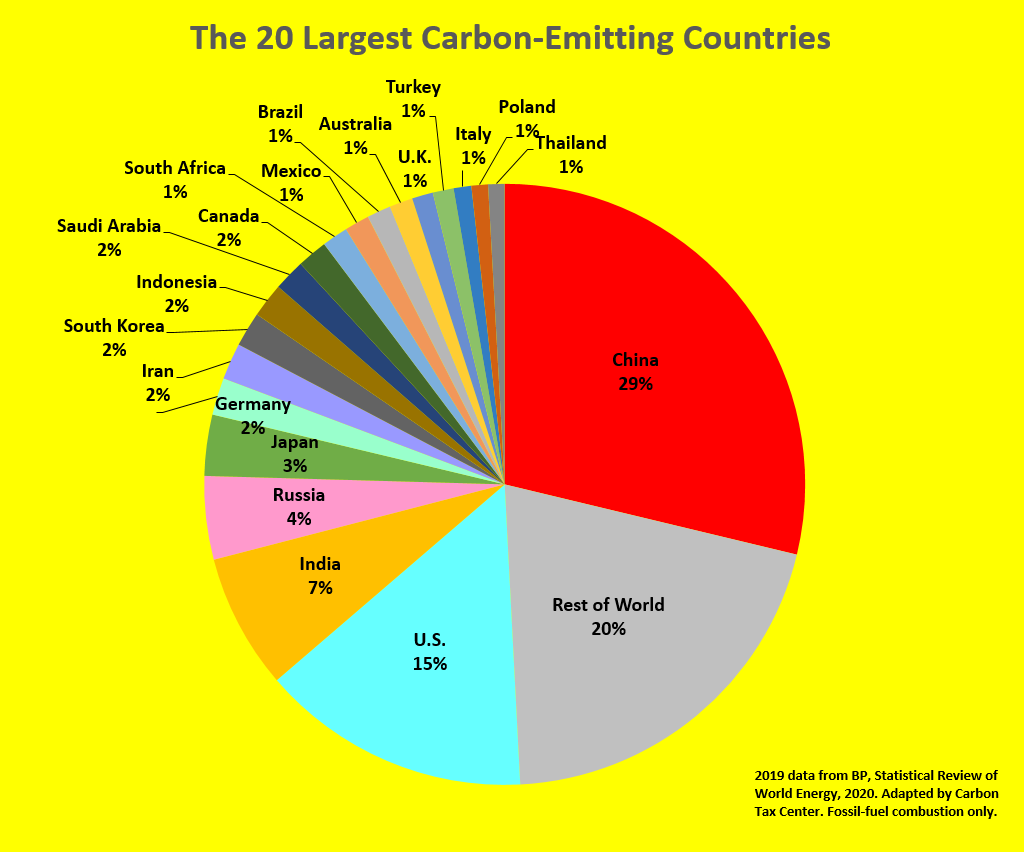
Which Countries Are the Largest Carbon-Emitters?
In case you were wondering:
Resources
Can We Price Carbon, a 2018 M.I.T. Press book by U-Michigan economics professor Barry Rabe, is “the most balanced look to date into the complex realities of carbon pricing,” says the renowned Resources for the Future scholar, Dallas Burtraw. “Rabe provides an essential starting point for serious thinking about how to make progress on climate policy. This book is a triumph.”.
Making Climate Policy Work, a 2020 book from Polity Books and Wiley, by Danny Cullenward and David G. Victor, casts a more critical eye at carbon taxing and other pricing schemes. The publisher’s page says it “shows how the politics of creating and maintaining market-based policies render them ineffective nearly everywhere they have been applied. Facing that reality requires relying more heavily on smart regulation and industrial policy – government-led strategies – to catalyze the transformation that markets promise, but rarely deliver.”
The Reality Of Carbon Taxes In The 21st Century, a 2009 book by a team at Vermont Law School’s Environmental Tax Policy Institute headed by environmental-taxation scholar Janet E. Milne, is a good snapshot of the more optimistic view prevalent at that time. The entire 114-page book may be downloaded here.
We invite visitors to this site to read these works and share their observations with us.