The European Union announced last week its intention to reduce emissions of greenhouse gases by 40% from 1990 levels by 2030. Meanwhile, the U.S. goal remains a 17% emissions cut from 2005 levels, by 2020.
Two different percentages over two different time periods. How do the EU and U.S. trajectories compare? Is the EU’s use of a 1990 baseline cheapening its goal, as some have suggested?
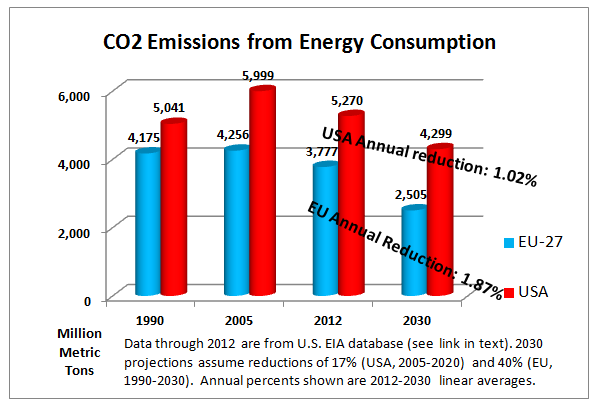
EU target is nearly twice as ambitious as US goal.
No, it turns out. As the graphic shows, the 27 countries making up the European Union generated slightly less CO2 in the EU’s baseline year of 1990 than in the 2005 baseline chosen by United States authorities. More importantly, after running a few numbers, we can safely report that the EU emissions objective embodies nearly twice as high a reduction rate to 2030 from 2012 (the most recent year with comparable data) as the US target: an average annual decline in emissions of 1.87% for the EU, vs. 1.02% for the United States. [Read more…]

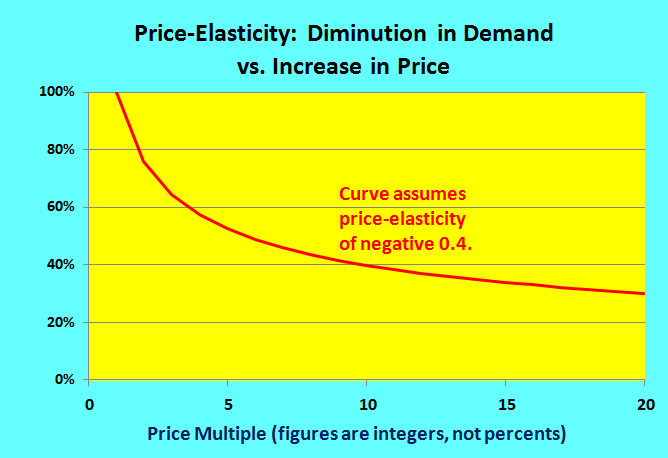 Demand price-elasticity denotes the extent to which rises in price engender a drop in demand. A price-elasticity of 50% means that the drop in demand is half as steep as the price rise. Thus, a 2% increase in price would be required to engender a 1% decrease in demand. Importantly, for large price increases such as we propose over time, the drops in demand would be proportionately less, reflecting the law of diminishing returns. And at the same time the phased-in tax is causing prices of fossil fuels to rise, incomes would be rising, offsetting some of the reductions.
 We agree with pioneering climate-scientist
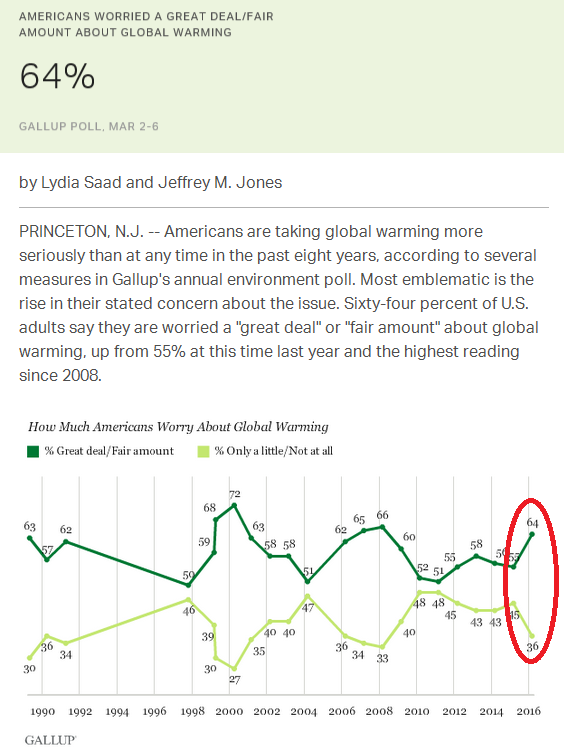 Other results from the 2016 Gallup poll are equally striking. They show a record-high share of Americans stating that climate change poses a threat to them and their way of life; a record number agreeing that climate change is caused primarily by human activity; and climate concern climbing across the political spectrum.