
NY Times columnist David Leonhardt, It’s 2022. What Does Life Look Like?, July 10.
New York Times Starts Embracing ‘Future without Cars’
I posted this on Streetsblog yesterday. It’s somewhat NYC-centric and doesn’t mention climate change, but it’s indicative of how fast opinion and, hence, policy can change, especially now, during the pandemic. — CK.
“Live long enough,” the saying goes, “and you’ll see everything.”
So it is. On Friday, we saw perhaps the first-ever NY Times link to “Banning Cars from Manhattan,” the seminal 1962 samizdat essay that suggested another urban world was possible. We also saw a 3,000-word essay revivify the truths in the classic 1980s underground sticker, “Ban cars from the city: They pollute, they kill people, they take up space.”
All this, and more, in a piece provocatively titled, “I’ve Seen a Future Without Cars, and It’s Amazing” by Times opinion columnist Farhad Manjoo — with a subtitle that dared to ask, “Why do American cities waste so much space on cars?”

Farhad Manjoo’s “The End of Cars” article led the New York Times’ Sunday Review section yesterday.
To paraphrase jazz immortal Sun Ra, space is place for us urbanists. To me, what makes Manjoo’s essay so distinctive is its focus on the immense space cars and driving require. That, plus its conviction that New York and other cities can and must be transformed, now — during and post pandemic; plus that it appeared in the New York Times, automatically giving it currency and gravity.
Space — the word — appears 19 times in the essay. Its close cousin, land, shows up for 15. “If cars are our only option, how [after the pandemic] will we find space for all of them?,” Manjoo muses. Cities’ “worst mistake [was] giving up so much of their land to the automobile,” Manjoo declares:
Automobiles are not just dangerous and bad for the environment, they are also profoundly wasteful of the land around us: Cars take up way too much physical space to transport too few people. It’s geometry.
Cars wasting space is old hat to anyone who spends much time biking in New York City. And the hopeless geometry of cars in cities has been a thing on “Transit Twitter” for some time. But I’ll bet Manjoo’s message struck Gray Lady readers as fresh and new. Even if they’re now schooled in tailpipes and carbon and crashes, most “normies” probably haven’t thought that “as roads become freer of cars, they grow full of possibility.”
Manjoo is speaking to this car-cocooned majority, sagely anticipating their objections and trying to help them get over, with passages like this:
What’s that you say? There aren’t enough buses in your city to avoid overcrowding, and they’re too slow, anyway? Pedestrian space is already hard to find? Well, right. That’s car dependency.
Without cars, Manjoo explains, “Manhattan’s streets could give priority to more equitable and accessible ways of getting around.” Crucially, these better ways aren’t ride-hails or Teslas or self-driving cars. Indeed, one of the essay’s notable feature is its kiss-off to digerati fantasies of melding technology, automobiles and cities. (Manjoo, a former reporter, covered Silicon Valley.)
No faux disrupter, Manjoo is going sustainable and long, urging bike superhighways and bus rapid transit and congestion pricing and ample sidewalks — elements of a wholesale repurposing of the vast space taken up by moving cars, parked cars, cruising-for-parking cars, stuck-in-traffic cars, refuel stations and the like.
In Los Angeles, “land for parking exceeds the entire land area of Manhattan, enough space to house almost a million more people at Los Angeles’s prevailing density.” And just in Manhattan, “nearly 1,000 acres … is occupied by parking garages, gas stations, car washes, car dealerships and auto repair shops.” (Central Park covers 840 acres.)
“The amount of space devoted to cars in Manhattan is not just wasteful, but, in a deeper sense, unfair to the millions of New Yorkers who have no need for cars,” Manjoo writes, before teeing up this killer quote from urban planner Vishaan Chakrabarti: “It really does feel like there is a silent majority that doesn’t get any real say in how the public space is used.”
Chakrabarti, whose Practice for Architecture and Urbanism firm provided underpinning for Manjoo’s column, here joins the Regional Plan Association in demanding that politicians stop coddling the pro-car NIMBY’s who overpopulate city community planning boards and problematize virtually every measure that might take space from cars.
“Cars aren’t just greedy for physical space,” Manjoo writes, “they’re insatiable,” calling out the true meaning of induced demand: “an unwinnable cycle that ends with every inch of our cities paved over” (an outcome sadly familiar to aficionados of Streetsblog’s Parking Madness tournaments).
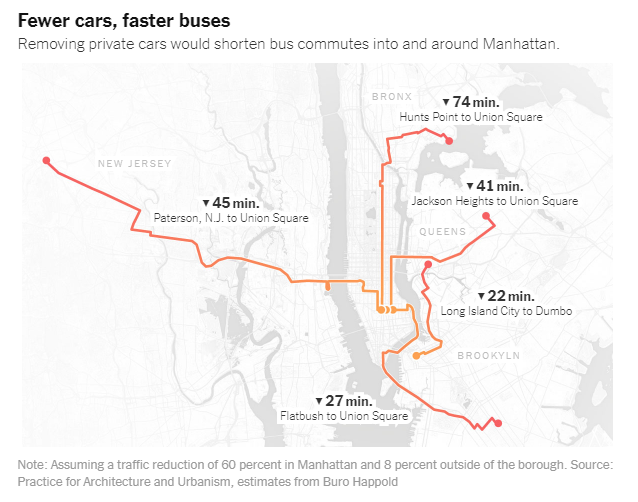
Shortening of commute times in map assume 60% reduction in traffic in Manhattan, with “ripple” reductions in neighboring areas.
“Cars make every other form of transportation a little bit terrible,” Manjoo adds, perhaps understating. “The absence of cars, then, exerts its own kind of magic — take private cars away, and every other way of getting around gets much better.” That goes for walking, biking, scootering, even taxis and Ubers, Manjoo notes, but, above all, for buses, as the graphic at right showing time savings from removing Manhattan car traffic makes clear.
I posted that graphic on Twitter in response to concerns that barring most private autos from Manhattan and upgrading bus service to BRT, as Manjoo suggests, “wouldn’t serve equity.”
“On what planet,” I asked, “is cutting super-double-digit minutes off bus commutes in/around NYC not a win for equity?”
Of course, a win for equity like humane and efficient buses is a poor stand-in for an across-the-board commitment to equity, as was pointed out in response.
“A true commitment to equity changes the power structure for making decisions,” added another commenter — and I fully agree.
But I don’t think it’s helpful to fault Manjoo’s article, or their vision, for failing to confront power structures that enforce economic inequality or white supremacy. Dismantling those structures is the paramount work of our time, in my view. And I want no part of any measures that would further entrench them. Yet making New York and other cities safe, sustainable and habitable for their hundred million or more inhabitants is also vital. I’ve seen nothing suggesting that aggressively reducing car dependence along the lines urged by Manjoo will either interfere with that work or worsen conditions for communities of color and other underserved constituencies.
The 2021 races for mayor, public advocate, comptroller and city council are fast approaching, and Manjoo has sent NYC livable-streets advocates a clear signal to elevate our game. The signoff from their column gets the last word (emphases added):
Many of the most intractable challenges faced by America’s urban centers stem from the same cause — a lack of accessible physical space. We live in a time of epidemic homelessness. There’s a national housing affordability crisis caused by an extreme shortage of places to live. And now there’s a contagion that thrives on indoor overcrowding. Given these threats, how can American cities continue to justify wasting such enormous tracts of land on death machines?
How, indeed?
if you’re distressed by the devastating costs of covid-19 wherever officials have dismissed and denied the science and public health warnings — wait til you see the vastly greater costs of the same officials’ same dismissal and denial of climate change.”
New Yorker staff writer Philip Gourevitch (@PGourevitch), on Twitter, July 2.
I and other activists in my community are focused on issues that feel like immediate life or death, like the environment.”
Scranton, Pa. resident Kaitlin Ahern, 19, quoted in June 30 NY Times story, ‘I Can’t Focus on Abortion Access if My People Are Dying’, about younger U.S. women’s lower prioritization of abortion rights vis-a-vis other justice issues.
Is Big Carbon’s ‘Social License’ a Worthy Target?
We’re grateful to Gavin Grindon, a lecturer in art history at the University of Sussex, U.K., for his trenchant analysis last week of Big Oil’s longtime strategic sponsorships of museums and other prestigious cultural media in Britain and the United States.
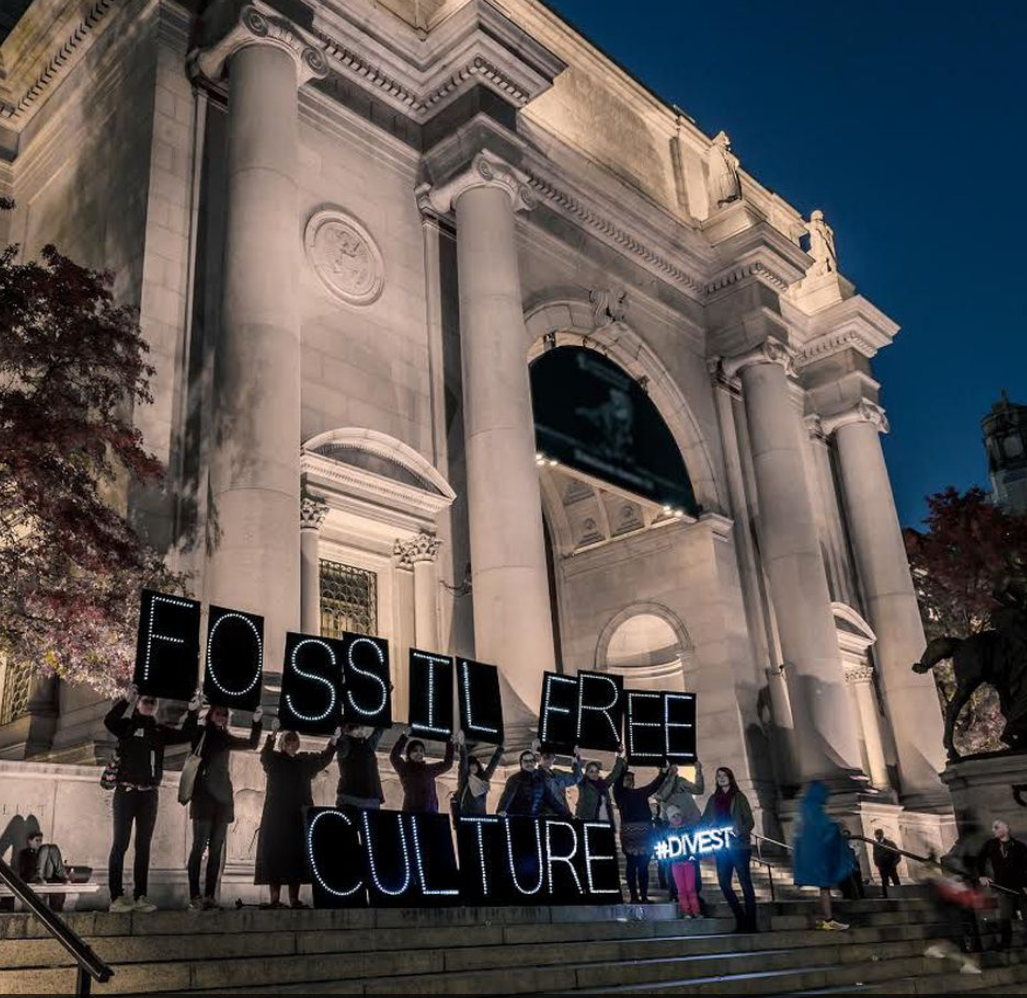
NYC Light Brigade outside the American Museum of Natural History, 2016. Photo by Erik McGregor.
In a Memorial Day New York Times op-ed, This Exhibition Was Brought to You by Guns and Big Oil, Grindon made clear that “For big oil, big pharmaceutical companies and the arms industry, sponsorship of the arts is not charity; it is a strategic expenditure.”
“To conduct their business,” he explained, “companies must build a web of influence and operation through many of the institutions that are often clustered in cities, through which they become enmeshed in our lives. London, for example, is one of the main financial centers for the oil industry. Oil companies must extract from the city a combination of services, so that elsewhere they may continue to extract, refine, transport and sell oil.”
Grindon described how this “extraction of services” works:
This is a matter not only of buying financial services from private companies, but of creating legal, political and technological leverage; facilitating clearance from regulators; gaining support from government departments or legal permission for new projects. Cultural institutions are a key part of this infrastructure into which businesses must insinuate themselves to establish an air of social legitimacy and acceptability for practices that might otherwise risk coming into question. (emphasis added)
In Britain, Grindon noted, corporate cultural insinuation typically takes the form of branded museum sponsorships which “offer businesses the attention of influential audiences, access to senior government figures at special events and the opportunity to securely intertwine themselves with ideas of national history and culture.” Whereas in the United States, cultural insinuation is more commonly conducted “through a system of boards that reward individuals who make charitable donations to the museum with the culturally influential position of trustee.”
You can’t ask for a more richly embroidered depiction of how oil and other companies “cynically use art to build webs of influence and become further enmeshed in our lives,” as the subhead of Grindon’s op-ed put it. Yet the question remains: Just how much do these webs of influence actually keep modern industrial societies locked into oil and the other fossil fuels? And the corollary: How effective, really, is deligitimizing Big Carbon — kicking fossil fuel executives off museum boards, university boards, other corporate boards, etc., “shaming” them, for short — in resetting governmental policies that enforce carbon “lock-in” against energy efficiency, renewable energy and other carbon alternatives?
Someday, social science may have the answers. For now, we’re skeptical, Grindon’s evocative essay notwithstanding.
Image courtesy of Oil Change International (http://priceofoil.org/about/).
For one thing, Big Oil is already deeply enmeshed in our lives. Every trip in a petrol-fueled car, every delivery to our doorstep from a van or truck, every airplane journey manifests and reinforces our complicity with oil. The “shame” of causing climate change isn’t limited to the fossil fuel companies, notwithstanding headline-garnering reports proclaiming that “Just 100 companies are responsible for 71 percent of global [carbon] emissions.”
Assume, moreover, that the boards of the Guggenheim, the Met, the Moma, the Whitney and the New Museum, to name five museums targeted by “protests over their links to issues like the oil and arms trade, gentrification and colonialism,” according to Grindon, were 100 percent free of fossil fuel executives. How exactly would that slow the rate of carbon emissions today, next month, a decade or now?
Yes, the legal, political and technological leverage that helps clear the paths to new oil fields and new markets, along with the regulatory clearance, governmental support and permissions, and other realms that Grindon lacked space to mention such as university R&D — would all become incrementally harder to obtain and hence more expensive to acquire. That in turn could make petroleum fuels somewhat more expensive to produce, thus hiking their prices and reducing demand. But in our estimation, these slightly higher hurdles wouldn’t materially change the infrastructural inertia and broad acquiescence that keep oil and coal and gas firmly in the saddle.
Sure, we’re all for ostracizing fossil fuel executives and others who lobby elected officials, strong-arm regulators, intimidate landowners and in some cases instigate lethal violence against protectors of nature, all to extract more petrol whose combustion products add to climate wreckage. But at what point, if ever, does this ostracism penetrate to Joe Sixpack in the showroom choosing between the F-150 that delivers 22 miles to the gallon and the F-350 that gets just 15? Or to the councilmember of a transit-rich city or suburb being pressured by NIMBY’s to reject upzoning and thus force local schoolteachers and sanitation workers to move to the auto-dependent exurban fringe? Or her counterpart in rural America or England who next week must cast the deciding vote on a wind or solar farm whose production would help phase out the gas-fired power plant three townships over?
We’ll say it again. In our view, the level of carbon emissions today and in the future is determined far more by structures of settlement, commerce and identity than by the decisions of a few hundred oil executive and business tycoons — whom we regard in any event as largely interchangeable, so long as demand renders their functions essential and profitable. And those structures, while seemingly unshakable, can be weakened and brought down with the help of carbon taxes.
Breaking Big Carbon requires huge mobilization along interconnected fronts of political action, public investment, culture change and carbon taxing. Exposing and stopping the oil industry’s cynical use of people’s longing for artistic experience is good work, and we support those doing it. But it’s not a substitute for the hard slog of politics, investment and carbon pricing. Let’s keep on with them.
Electricity Generation from Fossil Fuels Has Fallen by One-Fourth in Western Europe in 2020
Up-to-the-minute data show a 25 percent drop in electricity generation from fossil fuels this year by the five major European nations.
Combined kilowatt-hours made from burning coal, oil and gas in France, Britain, Germany, Spain and Italy totaled 209 terawatt-hours in the first five months of 2020 vs. 279 TWh in the same period a year ago, according to data aggregated by the Renewable Energy Institute from each country’s official sources and provided to the Carbon Tax Center. (A terawatt-hour equals a million megawatt-hours or a trillion watt-hours.)
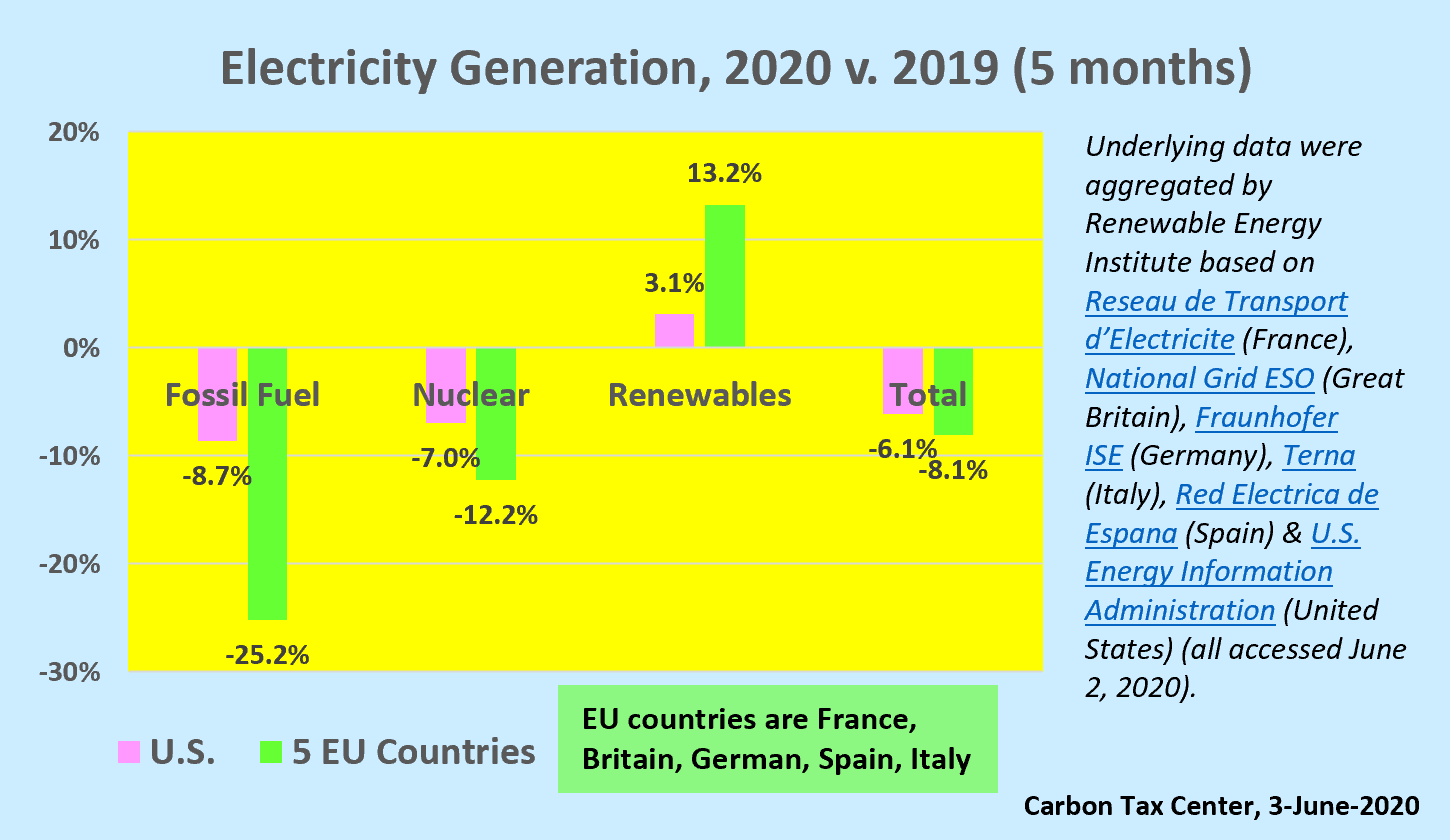
Electricity generation from fossil fuels fell 25 percent in the five largest European countries in the first five months of 2020.
Data for the United States for the same period show a lesser percentage drop, 9 percent, in electricity generation from fossil fuel plants. Nevertheless, in absolute terms the U.S. decline of 80 terawatt-hours of fossil electricity generation, from 924 TWh during Jan-May 2019 to 844 TWh in 2020, slightly exceeded the European shrinkage of 70 TWh. (The U.S. electricity sector is roughly twice as large as that of the five European countries combined, and the U.S. fossil-fuel component of electricity generation is three to four times as large as its European counterpart.)
Leading the way in Europe’s 2020 fossil-fuel power shrinkage is Germany, which until recently was widely maligned for prioritizing cuts to nuclear power rather than to its coal and lignite power generation since the 2011 Fukushima disaster. Through May of this year electricity production from fossil fuels in Germany is down by 29 TWh, a 31 percent drop from 2019. Britain followed close behind with a 17 GWh decline in fossil fuel power generation, a 30 percent cut from the prior year.
Propelling these declines are the lockdowns to contain the Coronavirus. Though the declines in road travel and aviation have received the lion’s share of attention, the EU and US data indicate that the power sector too has shrunk as economic activity has shriveled. Total electricity generation fell by 8 percent in the five European countries and 6 percent in the United States. Insofar as most lockdowns went into effect halfway through the period covered by the data, in mid-March, the figures suggest that the percentage declines in electricity since then may have been double the five-month figures, or on the order of 15 percent.
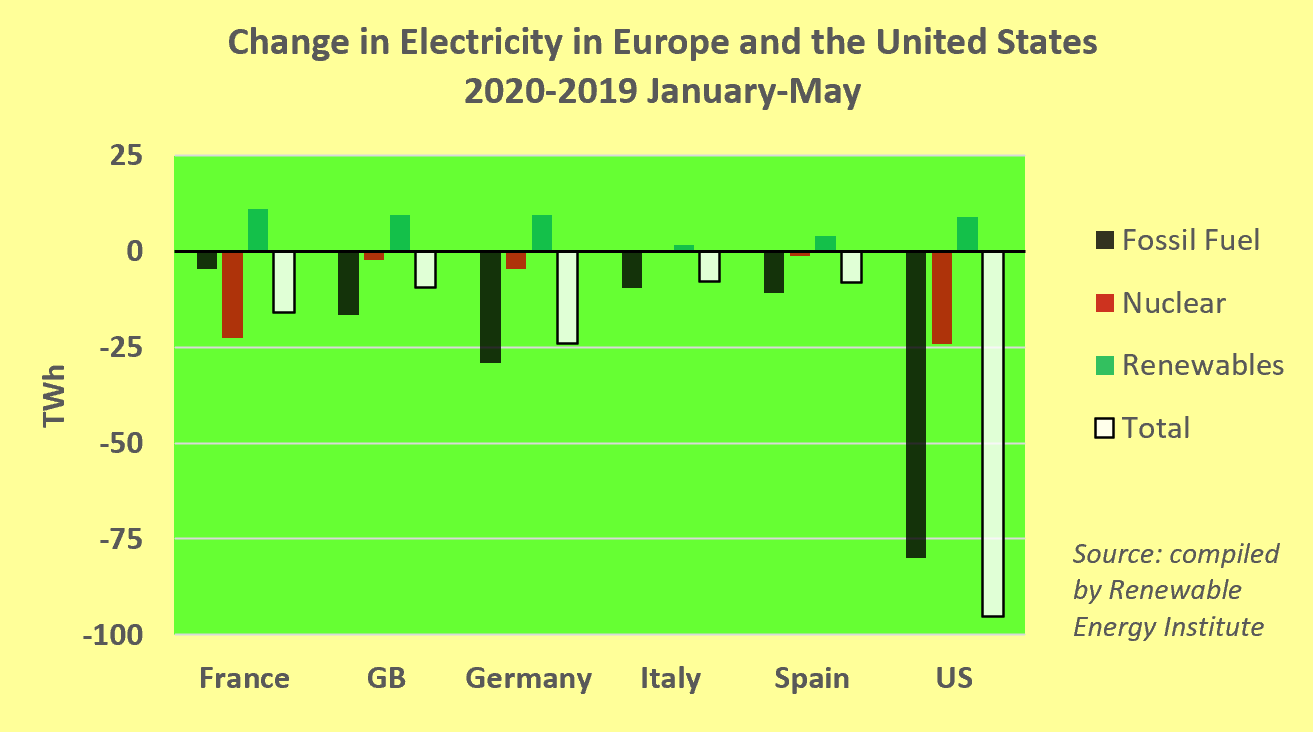
Nuclear power generation has fallen thus far in 2020 in all five countries. (The sixth, Italy, has no operating reactors.)
Curiously, nuclear power production also fell in the same period, and at a slightly greater pace than electricity generation overall: by 12 percent in the five European countries and 7 percent in the United States. (See chart at right, courtesy of the Renewable Energy Institute.) However, those declines were substantially offset by gains in renewable electricity generation, which in turn may have been abetted by what AccuWeather is calling the sunniest spring in Germany’s and England’s recorded histories.
“When demand falls, as it has during the Covid-19 pandemic due to measures taken to reduce the spreading of the virus, it is the fuel-based power generation that is economically hit,” wrote Tomas Kåberger, REI executive board chair, and Romain Zissler, senior researcher at REI, in a blog post reporting the 2020 and 2019 electricity data. “Falling demand results in lower prices in competitive markets,” they noted. And while “falling prices affect all producers’ margins, those who really suffer are the owners of power plants that have marginal costs so high that they cannot produce electricity at all,” wrote Kåberger and Zissler. “They lose all income, demonstrating the high risk of investing in fuel-based electricity generation.”
While the contractions in economic activity from the Coronavirus are expected to be transitory, the climate crisis of course is ongoing and deepening. Nevertheless, the data presented here demonstrate how the combination of electricity savings and renewable energy can leverage rapid decreases in fossil fuel-generated power and its carbon emissions.
When official GDP data are reported, it is likely that both the 25 percent drop in fossil fuel electricity in western Europe and the 9 percent decline in the United States in the first five months of the year will have exceeded the percentage decreases in economic activity. The job of western societies and governments is to expand policies to perpetuate and deepen the fossil fuel reductions during times of prosperity.
These 2020 findings mirror CTC’s analysis from last week demonstrating that during the 14-year period from 2005 to 2019, the combined effects of increased wind power, expanded solar electricity and continued growth in electricity savings accounted for the lion’s share of the enormous (one-third) drop in CO2 emissions from the United States power sector, far outpacing the contribution from replacing coal with fracked methane.
The Good News Trump Couldn’t Kill: Clean Electricity is Still Outpacing Fracked Gas in Kicking Coal to the Curb
Three and a half years ago CTC announced what we called “the good news” of the U.S. electric power sector’s rapid decarbonization. Our December 2016 blog post and its accompanying report quantified the power sector’s 25 percent reduction in carbon emissions from 2005 to 2016 and clarified what accounted for it.
Clean Energy = Electricity Savings + Solar + Wind
That report, grandly titled “The Good News: A Clean Electricity Boom Is Why the Clean Power Plan Is Way Ahead of Schedule,” showed that while substitution of fracked gas for dirtier coal contributed to reducing emissions, a greater role was played by clean electricity: an upsurge in electricity production from renewables (wind turbines and solar photovoltaic cells), and electricity savings that caused electricity usage to flatten even as economic output increased.
Today, in an updated version of that report, we extend those findings with new data through 2019, and the results are impressive and satisfying.
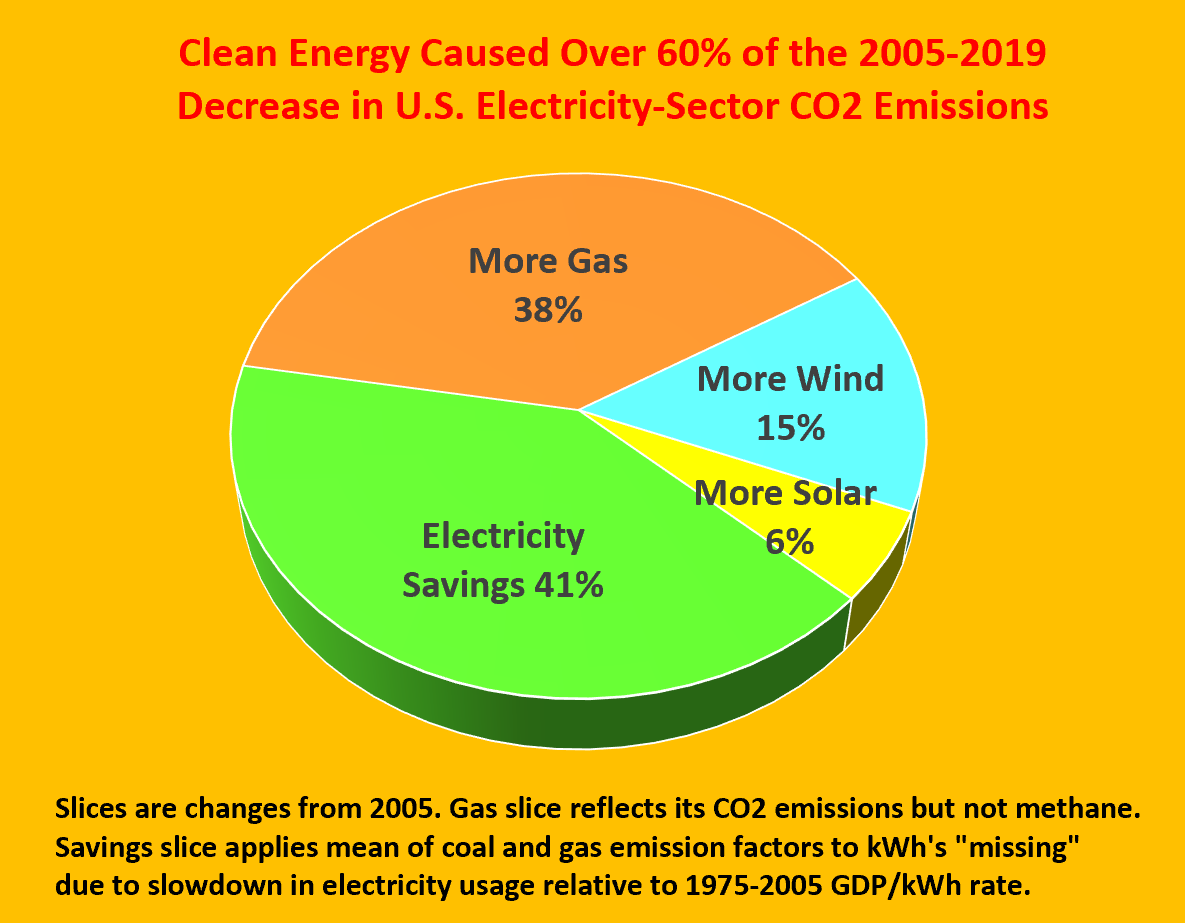
We find that in 2019 U.S. electricity sector emissions of carbon dioxide were 33 percent below 2005 levels, thus surpassing, eleven years ahead of schedule, the Obama Administration’s Clean Power Plan goal of a 32 percent cut in electricity-generation carbon emissions from 2005 to 2030. We estimate that 62 percent of the electricity sector’s carbon reduction since 2005 has been due to clean electricity, with the other 38 percent due to substitution for coal by natural gas.
This finding depends critically on the fact that from 2005 to 2019, total U.S. generation of electricity rose by a mere 2.4 percent — equivalent to an annual average growth rate of just 0.17 percent — even as the U.S. economy, measured imperfectly yet officially by Gross Domestic Product, expanded by nearly 28 percent. The majority contribution to electricity decarbonization of clean electricity belies the prevailing narrative crediting fracked gas for the lion’s share of the reduction in coal burning and the resulting lowering of carbon emissions.
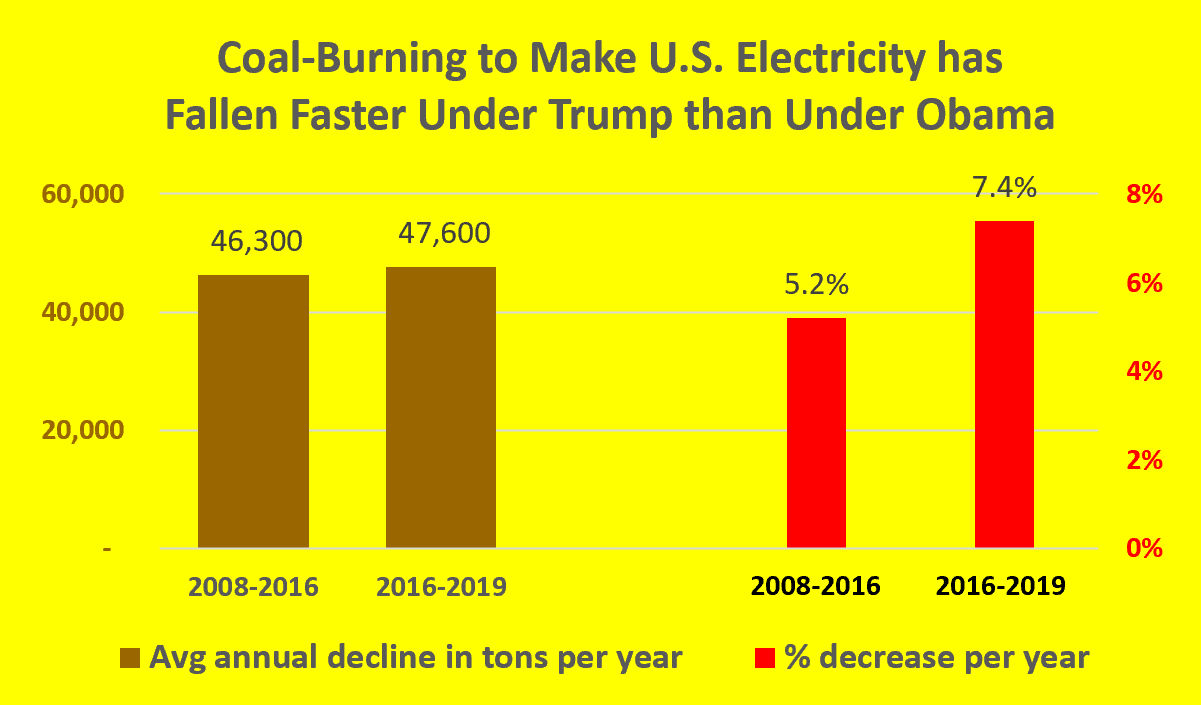
Our new report, “The Good News Trump Couldn’t Kill: The Clean Electricity Boom Is Doing More Than Fracking To Decarbonize America’s Power Sector” (download as pdf), also finds that the burning of coal to make electricity in the U.S. shrank at a faster clip during the Trump administration (2019 vs. 2016) than over the course of the Obama administration (2016 vs. 2008). The respective annual decline rates in tons per year were 47,600 (Trump) and 46,300 (Obama); expressed as percentages, the respective annual decline rates were 7.4 percent per year (Trump) and 5.2 percent (Obama). (The average percentage difference between the Trump and Obama years is greater than the tonnage difference because of the Trump years’ lower baseline level.)
 The free fall in use of coal to make electricity has been widely reported. The role of electricity saving has not. This is partly due to the difficulties of quantifying electricity savings and of booking those savings as reductions in uses of particular fuels. (Our solutions are to calculate the savings relative to hypothetical electricity generation if the 1975-2005 relationship between electricity growth and economic growth had continued; and to assign half of the reduced kilowatt-hours to coal and the other half to natural gas.)
But the failure to give electricity saving its due runs deeper. The penetration of energy-saving digital technologies in energy management, product design and manufacturing isn’t an eye-catching subject. Neither is the emergence of a business sector that finds, finances and delivers money-saving efficiency improvements in commercial and apartment buildings. Nevertheless, both phenomena are widespread and robust. So are ratepayer-funded energy-efficiency programs mandated by state public utility commissions, often with the insistence (and guidance) of tenacious and knowledgeable environmental groups.
Nevertheless, the flattening of U.S. electric usage and generation from the 7% annual growth rates that prevailed for most of the first three-quarters of the 20th century, down to 2.5% average growth from 1975 to 2005, and to just 0.2% per year annual growth from 2005 to 2019, is a profound development warranting much greater attention — if not in mainstream journalism then at least in energy and climate reporting. We hope that publication of this updated “Good News” report will help spur this notice.
In one of the stupidest statements in history, Trump just said ‘if we didn’t do any testing, we’d have very few cases’ of the pandemic coronavirus. Thus introducing the Republican solution to #climatechange: just stop reading the thermometers.”
Peter Gleick (co-founder, Pacific Institute; MacArthur “genius award” recipient; member, National Academy of Sciences), via Twitter, May 15.
It’s Earth Day — Let’s Celebrate New York City’s Cleaner Air
I posted this on Streetsblog yesterday, April 22, the 50th anniversary of Earth Day. It’s NYC-centric and doesn’t mention climate change (!). But its lessons apply nationwide, and good news is always welcome, especially now. PS, there is Covid-19 content, toward the end. — CK.
On Thanksgiving Day in 1966, I was driving from my parents’ home in suburban Long Beach, NY to dinner with family friends in Forest Hills, Queens. The air seemed extra bad. My eyes were teary, my nostrils were twitching and the radio was reporting some sort of pollution episode.
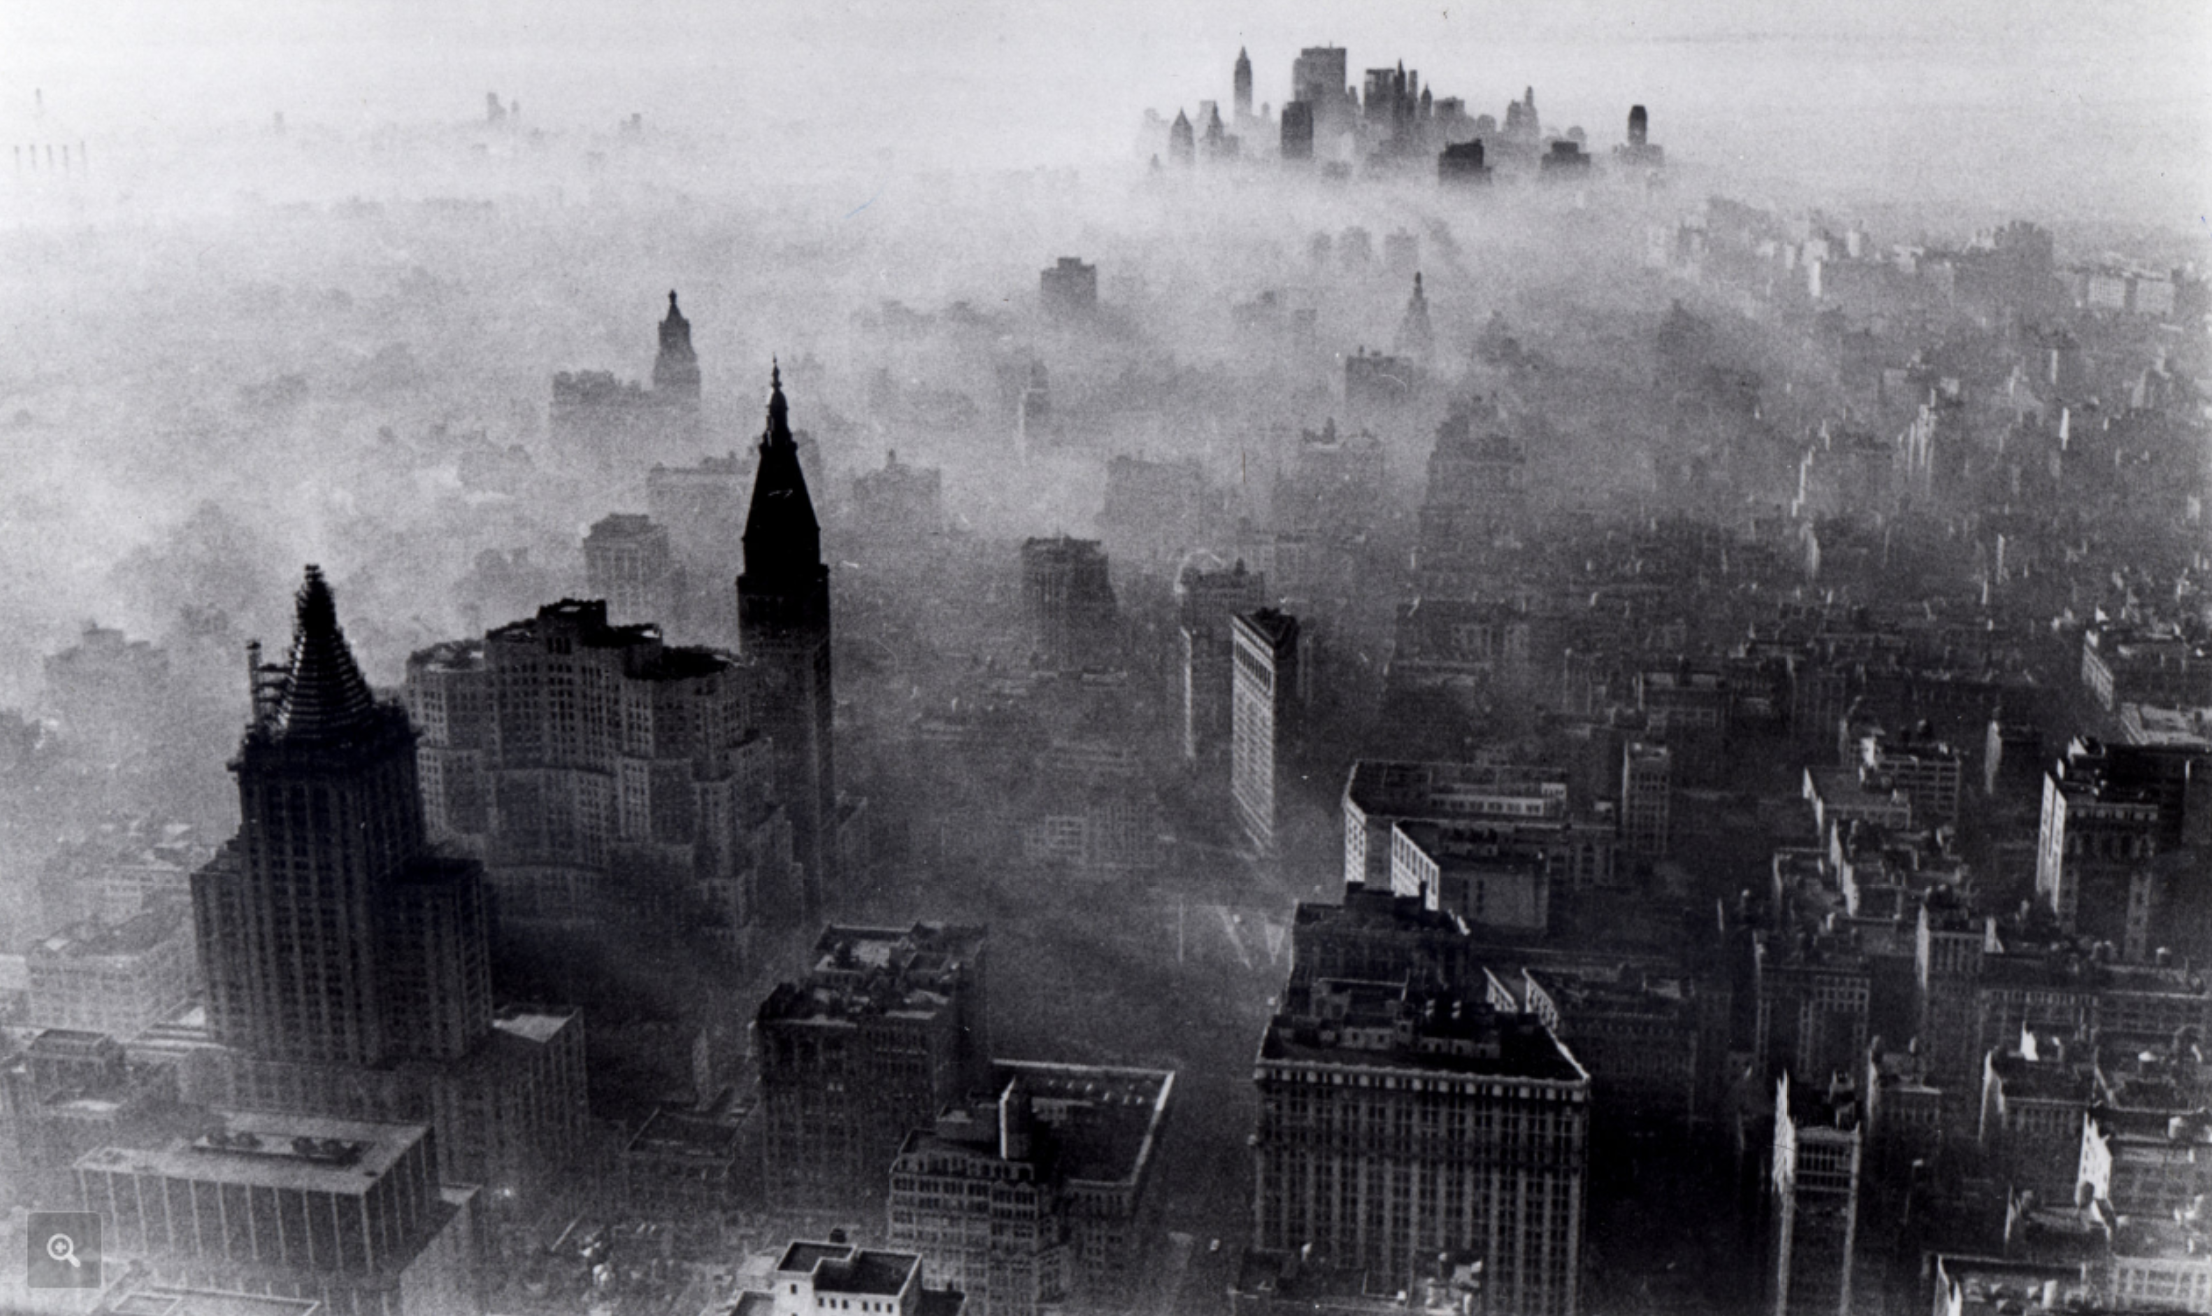
Photo: Neal Boenzi / courtesy New York Times.
At that very moment, New York Times photographer Neal Boenzi was memorializing what the air looked like from a perch high up in the Empire State Building: smog shrouding skyscrapers like Met Life, NY Life and the Flatiron Building; smoke obscuring the financial district; the Hudson and East Rivers, invisible.
Fast forward 50 years to a mid-September weekday in 2016. Former New York City government official and activist Jon Orcutt steps onto the India Street Pier in Greenpoint, Brooklyn and aims his iPhone at east Midtown. The contrast of his photo with Boenzi’s couldn’t be more stark, and not because one was black and white while the other was color and digital. Ocutt’s picture glistens with mountaintop clarity. Zoom in, and every building — every window — is distinguishable. Billowing clouds adorn the sky, multitudes of pristine blue and pellucid white.
A clear day in 2016. Photo: Jon Orcutt.
The distance between the photos attests to the past half-century’s clean-air revolution — a vast do-over to our nation’s skies, much of it led by New York City. Through citizen activism, enlightened governance and innovative technology, pollution levels were slashed across the board. No one knows the precise extent, but my best guess is that from the late sixties to today, citywide levels of noxious pollutants like PM2.5 (tiny particulates that invade and obstruct the lungs) and photochemical smog (a gaseous soup cooked by sunlight from nitrogen oxides and volatile organic compounds) fell by over 80 percent. Another lethal pollutant, sulfur dioxide, almost certainly declined even more. (The writer-activist Bill McKibben reported this week in his weekly New Yorker magazine climate newsletter that “air pollution has dropped by more than sixty per cent across America since 1970.”)
These improvements didn’t just enhance public health and cut medical costs. They also contributed to New York City’s economic resurgence. Here, too, no one knows precisely how much; polls don’t ask if cleaner air factored into people’s decisions to settle here. But my guess is that, after reduced street crime, cleaner air has been on a par with better schools and improved public transportation in attracting and retaining residents and businesses to New York.
No single regulation or program or anti-pollution device wrought these striking gains. Rather, a multiplicity of initiatives reduced air pollution levels here. These have probably been key:
- Lowering five- to 10-fold the sulfur content of fuel oil burned for heating and power generation*
- Tailpipe and engine technologies that cut per-mile auto emissions at least 10-fold
- Cleaner fuels and engines for diesel-powered heavy vehicles (still a work in progress)
- Investments in mass transit that stanched growth in auto travel (partly undermined by Uber)
- Widespread switching of dirtier oil-fired power, furnaces and boilers to natural gas
- Decommissioning in-building incinerators
- Controls on emissions from upwind sources such as refineries and power plants
* = CTC readers will enjoy my 2009 post in Grist relating how NYC’s 1972 emergency surcharge on dirty oil — an early instance of Pigovian taxation — protected the city’s low-sulfur oil regulation from oil industry interference.
These developments didn’t happen by themselves. They were, and are, the most visible and impactful fruits of the environmental movement whose arrival 50 years ago as a political and cultural force we mark on Earth Day today. At its forefront were the Natural Resources Defense Council and NYC-based organizations such as Citizens for Clean Air (which preceded Earth Day), Straphangers Campaign and Transportation Alternatives (which came in its wake); indefatigable campaigners like Gene Russianoff, Marcy Benstock, Rich Kassel and the late Carolyn Konheim; and proactive city officials like Mayor John Lindsay, his Environment Commissioner Jerry Kretchmer, and engineering dynamo Brian Ketcham. In turn, these individuals and institutions were backed by (and often preceded and helped spark) federal environmental legislation enacted in the national upwelling of environmental activism that took full flower in the early 1970s.
It is true, and shameful, that, nationwide, communities of color today breathe dirtier air than wealthy, white areas (though in New York City there is surprising overlap between affluence and pollution). Even so, air quality has risen significantly in most environmental justice communities in recent decades, with more gains likely as ecological activism grows increasingly black- and brown-led, although that, of course, depends heavily on the outcome of the next election.
I have labored in recent years to foster appreciation of air quality progress, especially in New York City. Valorizing environmental regulations and, at least implicitly, the scientists, attorneys and activists whose labors and expertise brought them into being, isn’t just right, it’s an investment in protecting and enhancing our environment going forward.
Well, my project has a ways to go. Case in point: this statement in a recent New York Times story on a preliminary Harvard School of Public Health study linking higher levels of PM2.5 pollution with increased COVID-19 deaths:
If Manhattan had lowered its average particulate matter level by just a single unit, or one microgram per cubic meter [µg/m3], over the past 20 years, there would have been 248 fewer COVID-19 deaths in Manhattan by that point in the outbreak [April 5].
That framing is completely backwards, in my view. Rather than bemoaning the failure to reduce New York pollution levels by one hypothetical unit, we should be celebrating the reductions already accomplished. They are enormous: almost certainly more than 20 µg/m3 since 1970 (early baseline data for New York and other cities is sketchy). If the preliminary link between particulate pollution and COVID-19 mortality in the Harvard study is confirmed, then NYC’s pollution reduction since the time of Earth Day will be shown to have spared vast numbers of lives through population-level improved lung functioning.
(The linkage between polluted air and COVID-19 mortality is this, in a nutshell: the coronavirus kills primarily by ravaging people’s lungs, while chronic exposure to fine particulate matter and other air pollutants degrades lung functioning, rendering inhabitants of polluted areas more vulnerable once they’ve been infected. Conversely, the advent of cleaner air has given New Yorkers a hidden but sizable degree of immunity, relative to our susceptibility if the air had remained chronically polluted.)
It’s tempting to recast the pull-quote from the Times in terms of thousands of New York City COVID-19 deaths already averted, but I’m going to demur. For one thing, the hypothetical 248-lives figure there (which the Times article took directly from the preliminary Harvard paper) was calculated from a baseline of citywide deaths and ascribed (incorrectly) to Manhattan alone. More importantly, I’m not convinced that the correlation between PM2.5 pollution and COVID-19 mortality is as strong as the paper contends. Despite laudable effort by the authors, their county-level analysis may not have been fine-tuned enough to fully control for the 17 different possible confounding factors they included in their model such as population density and education levels.
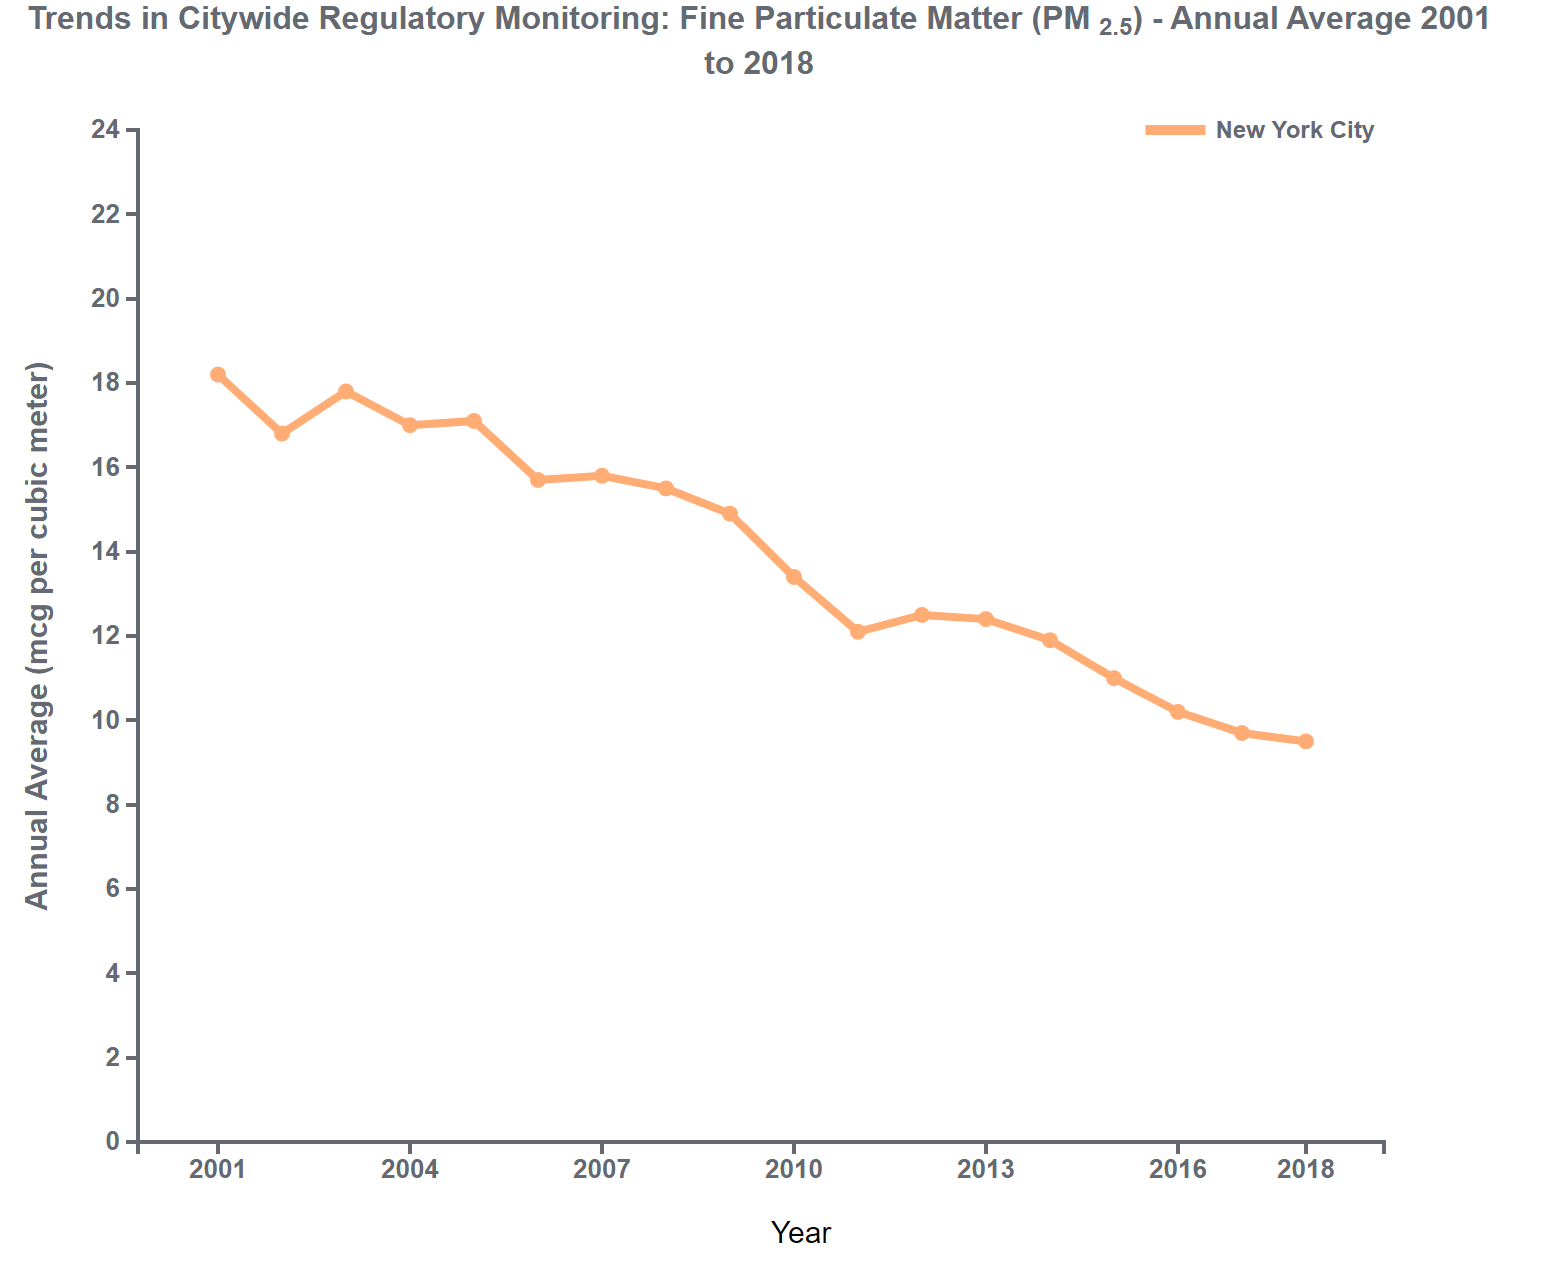
City Department of Health data show that PM2.5 pollution nearly halved in less than two decades.
Consider that from 2001 to 2017, a period rigorously analyzed by environmental-health experts at NYC’s Department of Health, citywide average PM2.5 levels declined from around 18 µg/m3 to around 10 (see graph). That’s a drop of 8 µg/m3 in just 16 years. If we extend that rate of improvement backwards to the three decades leading to 2001 — when many of the innovations I bulleted earlier were taking effect — the drop in PM2.5 in that period would be around 16 µg/m3. That would yield an overall reduction of 24 µg/m3 in fine particulate pollution levels from Earth Day to today.
But today, let’s lift our gaze from COVID-19 and epidemiology to New York’s clearer skies. Dear reader, please join me in toasting a half-century of scientist and activist vision and grit that has made — and continues to make — our city cleaner, healthier and more beautiful.
CO2 emissions will shrink this year. How much?
Note: We’ve revised this post to reflect an April 15 update from Carbon Brief in which it raised its CO2 reduction projections for 2020. More details appear at end of post. — C.K., April 29.
A new post this week from Carbon Brief’s Dr. Simon Evans, Coronavirus set to cause largest ever annual fall in CO2 emissions, projects a 5-6 percent fall this year in worldwide emissions of carbon dioxide from last year’s level on account of the coronavirus.
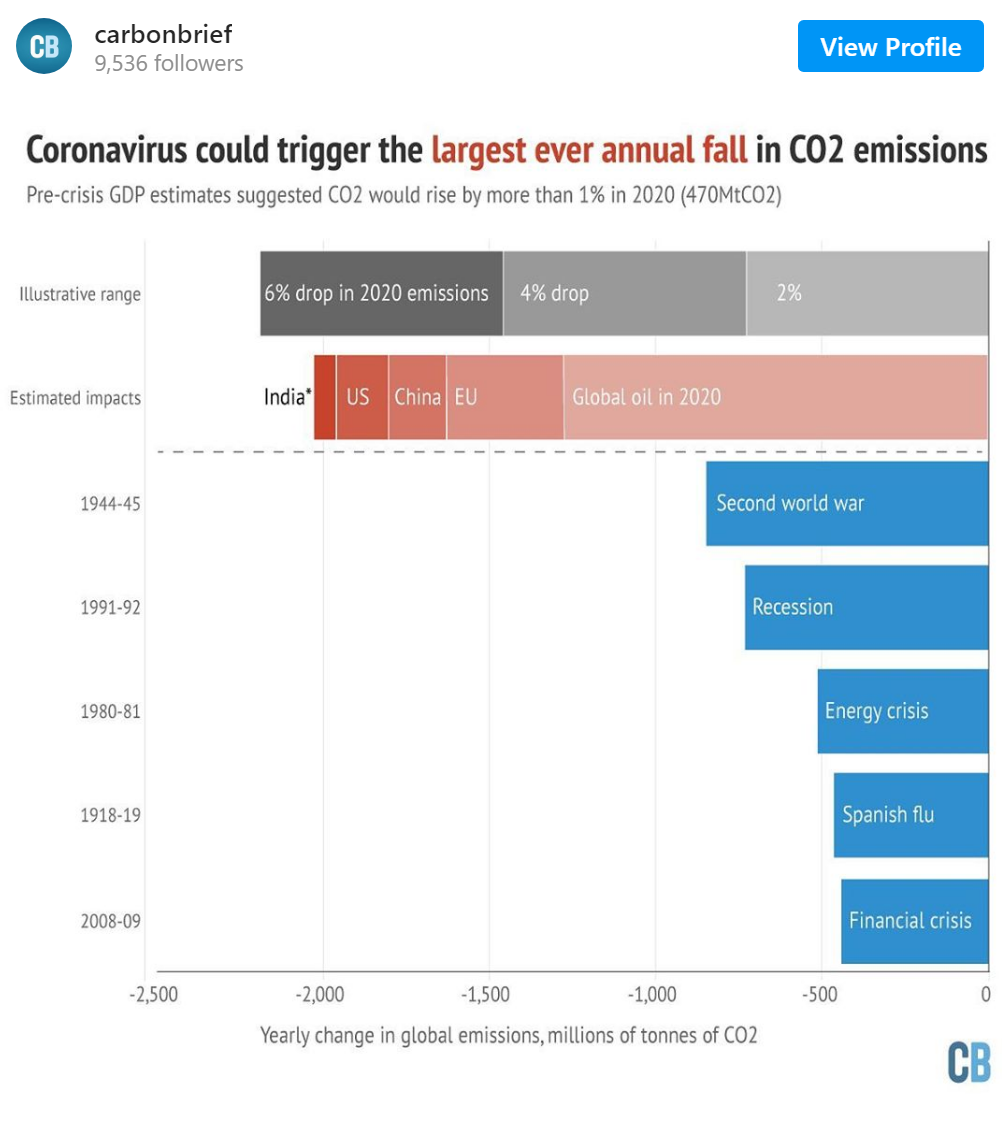
Courtesy, Carbon Brief. Geographical estimates exclude oil since that is subsumed in “Global oil in 2020” figure. Link in opening paragraph leads to CB post which has full graph notes and sources. Note that “tonne” unit is metric ton, or thousand kilograms.
Dr. Evans is highly regarded for his analyses of global energy trends, and his new post does not disappoint. His projections, shown at left, draw on what he calls “five key datasets and projections covering roughly three-quarters of the world’s annual CO2 emissions, including the entire output of China and the US, the EU carbon market, the Indian power sector and the global oil sector.” Those sectors’ projected reductions, shown in the rust-red bar near the top, sum to around 2,000 million metric tons, equivalent to 5.5 percent of the 2019 worldwide total.
The five trailing blue bars in the Carbon Brief graphic underscore the prospective downturn’s unprecedented extent. They denote actual reductions during traumatic world events, from the 1919 Spanish flu pandemic and the 1945 close of World War II to the 2009 financial crisis, which shows the smallest emissions drop. Using tons of decline as the metric — after all, the climate system responds to tonnages of CO2, not percentage changes — none of the earlier five contractions rivals Carbon Brief’s projected 2020 downturn. The closest is the 845 million tonne reduction in 1945, caused not just by the collapse of economic activity in defeated Germany and Japan but also by the battered economies of victor states such as the Soviet Union and the United Kingdom.
Last month, we at Carbon Tax Center published a post estimating that global emissions this year could plunge by as much as 7,640 million metric tons from their business-as-usual level. That would be nearly four times as great a reduction as the 2,000 million tonne drop in Dr. Evans’ Carbon Brief post, a huge gap but one largely explainable by these differences between our respective approaches:
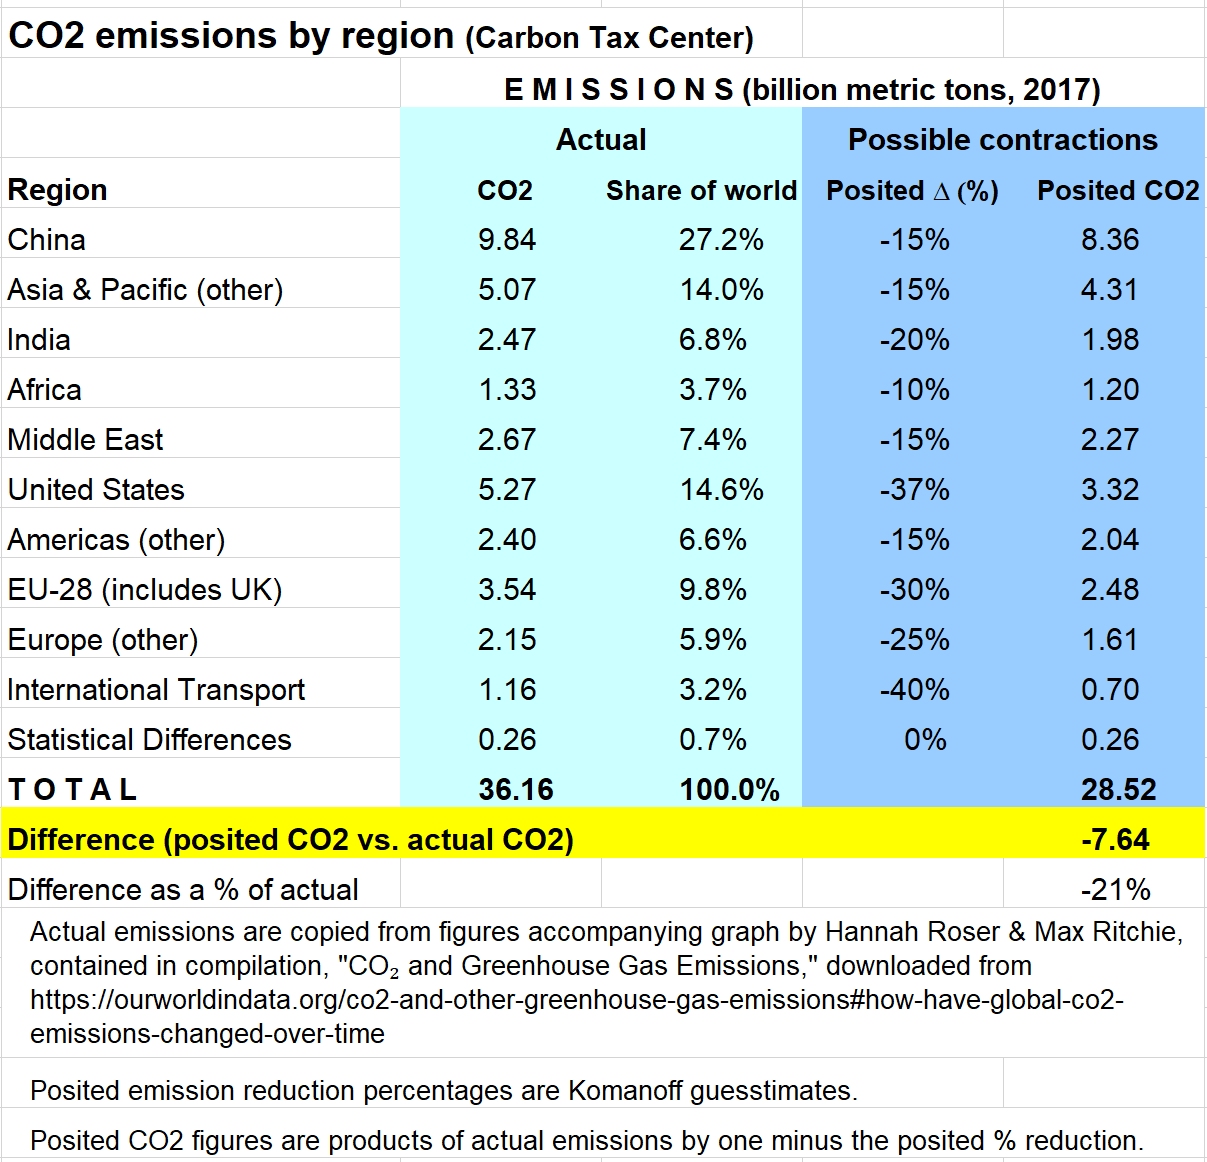
CTC’s “dire case” projections of CO2 declines by sector are copied from our March 24 post, Could COVID-caused economic cratering trim 1 ppm from atmospheric CO2?
- Carbon Tax Center’s figures are in Btu’s, a good but imperfect proxy for carbon emissions, whereas Carbon Brief employs CO2 directly.
- CB’s calculations omit sectors outside of its “top five,” which account for 24% of worldwide carbon emissions.
- CB conservatively applies its estimated reductions to a 2020 baseline that would have exceeded 2019 emissions by 1,000 million tonnes, effectively handicapping its 2020 reductions.
- CB chose to base its top five sector reductions on official, and necessarily conservative, sources such as the U.S. EIA, the IEA, and CB’s own mid-Feb. analysis of China’s CO2 reductions.
- CTC took a deliberately aggressive approach to estimating reductions in order to stake out an outer limit.
We add this sober warning from Dr. Evans’ post:
To put the potential 2020 coronavirus effect in a broader climate context, it is worth adding that global emissions would need to fall by more than 6% every year this decade – more than 2,200MtCO2 – in order to limit warming to less than 1.5C above pre-industrial temperatures. (This figure is based on the 2018 Intergovernmental Panel on Climate Change (IPCC) special report, which found that global emissions in 2030 needed to be 45% below 2010 levels, in order to limit warming to 1.5C.)
It should go without saying that the forced nature of the 2020 emissions contraction disqualifies it as a model for going forward. Nevertheless, surpassing, even under great duress, and even for just one year, the recurring 2,200 million tonne per year contraction cited as essential by Carbon Brief, is not to be sneezed at.
A useful way to think about CTC’s “extreme” 7,600 million tonne estimate is that it would buy the world three to four years worth of the 2,200 Mt reduction otherwise needed each year to the next … and that in 2023 or 2024 worldwide emissions would need to fall, from the reduced level, by 2,200 million tonnes each year, to get onto the IPCC trajectory for keeping warming to less than 1.5C.
Point being: while Covid-19 is not how the world should have started down the road to reducing emissions, it has gotten our attention and is, at least, a start.
Carbon Brief’s April 15 amendment to its original April 9 post (linked to at the top of our post) reads: Update 15 April 2020: This analysis was updated in light of new forecasts for global oil demand in 2020, which suggest a significantly larger drop this year. The original version had put the potential impact of coronavirus at 1,600MtCO2 in 2020, equivalent to 4% of 2019 emissions.
- « Previous Page
- 1
- …
- 12
- 13
- 14
- 15
- 16
- …
- 170
- Next Page »