

Today’s welcome announcement of a surprise U.S.-China agreement to curb greenhouse gas emissions almost certainly commits the United States to a national carbon price. Non-pricing measures, such as the EPA Clean Power Plan to cut power plant emissions and the ramp-up of auto fuel economy standards now underway, won’t be nearly enough by themselves to meet the new U.S. target of 25% lower emissions by 2025 vis-a-vis a 2005 baseline, according to calculations by the Carbon Tax Center.
This could be terrific news for carbon tax proponents, since it would finally require climate-concerned organizations and officials to put carbon pricing — preferably in the form of a revenue-neutral carbon tax — at the heart of their climate agenda. On the other hand, given the new Congressional ascendancy of the climate-deaf Republican Party, the 25% target could prove to be just another climate goal scuttled by U.S. political resistance.
Let’s start with the carbon emission numbers, which we’ve broken down between emissions from electricity generation, which account for around 40% of U.S. CO2 pollution, and emissions from the various “non-electric” sectors like automobiles, goods movement, air travel, industry and heating, which account for the other 60%. This division is useful for at least two reasons: there’s much greater maneuverability in electricity due to the relative ease of substituting clean sources like solar and wind for dirty coal and gas, and the U.S. already has an emissions goal for the electricity sector: the 30% reduction by 2030 (from 2005) embodied in the Clean Power Plan announced by President Obama this past June.
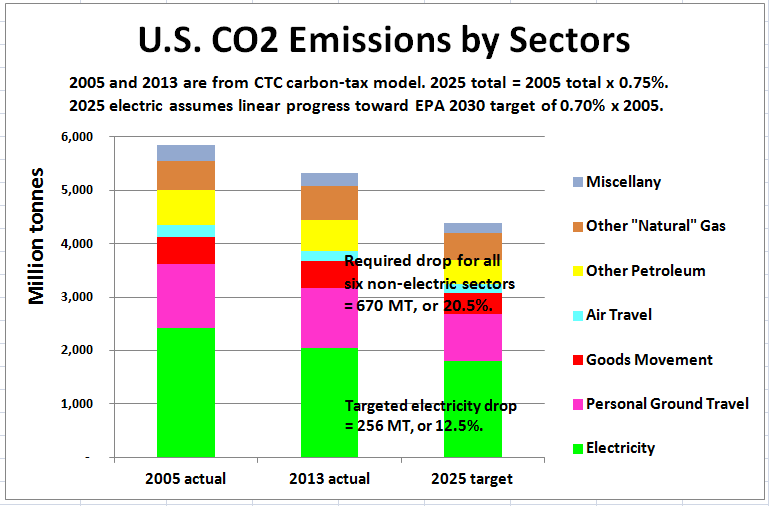
Non-electric-sector emissions will need to drop sharply to meet the 25% 2005-2025 reduction goal.
The key numbers are shown in the graphic. A 2025 target equaling 75% of actual 2005 CO2 emissions of 5,855 million tonnes (metric tons) from all U.S. sources equates to 4,391 million tonnes. With that figure established, let’s switch our reference frame to current (2013) emissions, which were 5,317 million tonnes. (All figures are from CTC’s carbon tax model, and some may differ from recently released official U.S. emission figures, but only slightly.)
The difference between 2013 emissions (5,317 million tonnes) and 2025-targeted emissions (4,391 million tonnes) is 926 million tonnes. That’s a 17.4% drop over just a dozen years. The questions are: where in the U.S. economy will these reductions take place, and how will they come about? (more…)


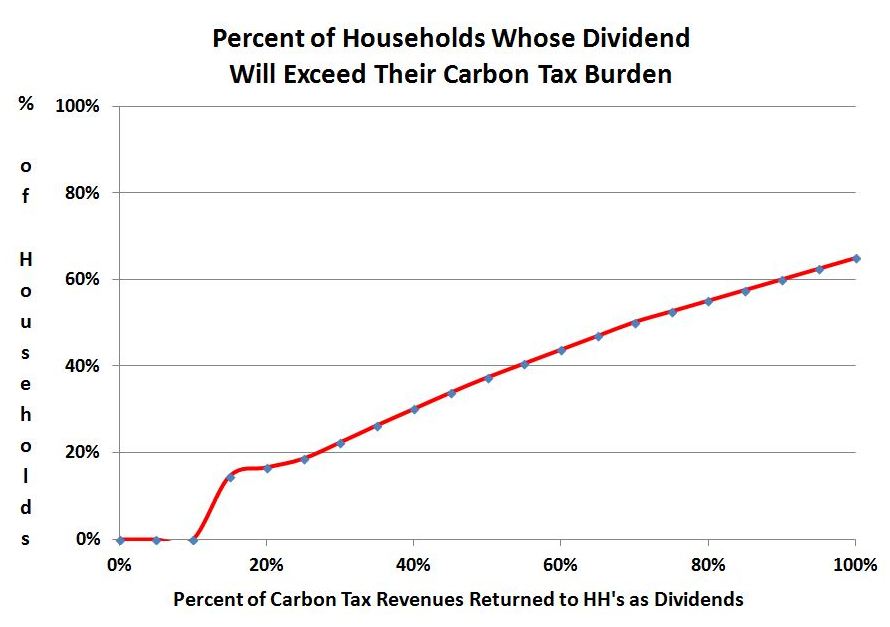
![A revenue-neutral carbon tax, in which all tax revenue would be returned to the public as a rebate check ["dividend"], receives 56% support. The largest gains in support [relative to opinion on a carbon tax w/o revenue mention] come from Republicans.](https://www.carbontax.org/wp-content/uploads/2014/07/Franklin-C-Note-_-reviewme23-_-flickr-_-downloaded-22-July-2014.jpg)