What drew me to pick up Andreas Malm’s book “How to Blow Up a Pipeline” and read it straight through over the July 4th weekend? Sure, the title was intriguing, but why exactly this book now?
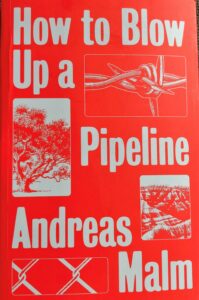
Verso Books, Brooklyn, NY (2021).
It wasn’t July’s climate chaos outbreaks — Oregon’s Bootleg fire, New York’s submerged subways, floods sweeping away picturesque German villages. Those came after July 4th.
Believe it or not, helicopters may have been a factor. The incessant thwack-thwack of tourist and “commuter” heli flights pervades every lower Manhattan sanctum — Governors Island, the Hudson River piers, even my apartment rooftop. The noise is universally loathed, yet, unsurprisingly, earnest entreaties by local anti-heli advocates haven’t moved the needle. With luxury helicopter pollution impervious to public outcry, might it be time to move to direct action? Malm’s book, I thought, might be instructive.
Meanwhile, policies for turning back the climate crisis are stalling out.
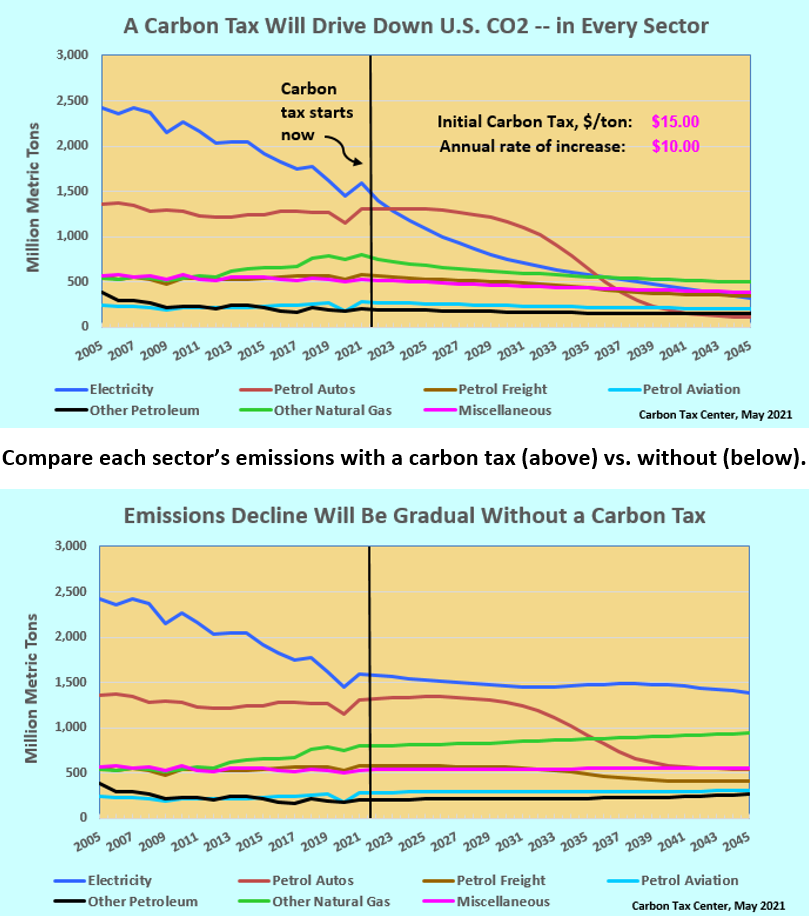
June, after all, was when milquetoast moderates Manchin and Sinema gave Senate Republicans carte blanche to filibuster away President Biden’s climate infrastructure bill, thus blocking what might have been a path to carbon-pricing legislation after the 2022 midterms — an idea we spelled out in April.
Closer to home, evidence was mounting that New York Gov. Andrew Cuomo was turning skittish on the plan I had helped design to dial back automobile gridlock in Manhattan by charging drivers for causing traffic congestion — a scheme he shepherded through the state legislature in 2019.
Bright hopes, dwindling. So why not see what Malm had to say? Though I was ambivalent about the title — not just the “blow up” part, but “pipeline.”

Not even “Ruining Shakespeare in the Park” (as the NY Post’s headline put it) stops tourist helicopter flights over NYC. Heli flight map by Melissa Elstein. Photo, © Helayne Seidman, used by permission.
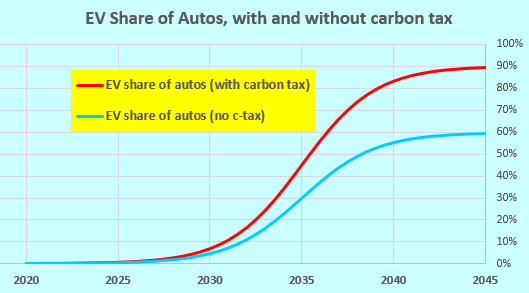
Here’s why. The Carbon Tax Center largely leaves disrupting the fossil fuels supply chain to others. We fight for demand destruction: crushing the “need” for carbon energy with carbon taxes. Outside of CTC I work for urban transit and practice culture change like redefining my travel wants so I can get to most places I need to reach by bicycle.
The surest way to starve and slay the carbon beast is demand destruction. If you stop a gas well or oil pipeline, another will come into being somewhere else to meet the demand. So go after the demand instead.
Malm’s book really catches fire when he addresses carbon consumption:
Why go after private consumption? Hasn’t the [climate] movement worked hard to shift attention away from consumers — the favored subjects of liberal discourse — to the production of fossil fuels? Wouldn’t pointing to the former represent a slide backwards? But consumption is part of the problem, and most particularly the consumption of the rich. [emphasis added]
At last: a voice on the left not just willing but eager to address the demand for fuels!
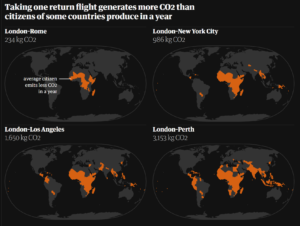
Taking a long-haul flight generates more carbon emissions than the average person in dozens of countries around the world produces in a whole year. Graphic + analysis by Niko Kommenda for The Guardian, 2019 (see link in text).
In his post here last week, Let’s Blow Up Luxury Carbon, journalist Christopher Ketcham offered up a few of Malm’s striking stats on luxury consumption. The visual at left, taken from a 2019 report in the Guardian, underlies another from Malm: “There are 56 countries in the world with annual per capita emissions lower than the emissions from one individual flying once between London and New York.”
To be sure, repugnant statistics such as these are by now deadeningly familiar. What I found novel in Pipeline is Malm’s way of articulating the “wanton criminality” of luxury consumption:
When the atmosphere is already glutted with CO2, extravagant excesses have directly injurious effects, which means, to skip the euphemisms, that they send projectiles flying towards randomly chosen poor people. The rich could claim ignorance in 1913. Not so now… The main source of luxury emissions — the hypermobility of the rich, their inordinate flying and yachting and driving — is what frees them from having to bother with the consequences, as they can always shift to safer locations.
Malm goes on to contrast luxury carbon with the “subsistence emissions” of the poor:
Subsistence emissions must be overcome just as much as any other, but they have none of these features of luxury in a CO2-saturated world: wanton criminality, insulation from the fallout, waste promotion, withholding of resources for adaptation, persisting in the most odious variants and ostentatiously negating the very notion of cuts… It follows that states should attack luxury emissions with axes — not because they necessarily make up the bulk of the total, but because of the position they hold. [emphasis added]
No such state attacks are happening, of course. If anything, the opposite is true, as Malm observes. France cut back taxes on aviation at the same time that president Emmanuel Macron, “king of climate diplomacy and private luxury … targeted the cars of the popular classes,” triggering the Gilets Jaunes uprising — a point Ketcham made as well in 2019 in Harper’s magazine.
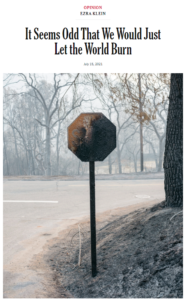
Even the New York Times’ redoubtable Ezra Klein admits he doesn’t know “how to force the political system to do enough, fast enough, to avert mass [climate] suffering.”
It might take attacks on luxury-emitting devices to break the spell cast in the sphere of consumption. Much like divestment has strived to remove the license from fossil fuel dividends and replace it with a stigma, the purpose here would be to hammer home another ethics: rich people cannot have the right to combust others to death. [emphasis added]
But how exactly to break the spell? We at CTC aren’t prepared to participate in or urge others to destroy property. The risks are too great, as Ketcham pointed out.
Today marks two years since Ketcham and I gathered on my Manhattan roof and, amid the din of the helicopters, understood that “the power to lord and the power to pollute are one and the same.”
Out of that came CTC’s three-pronged plan to Tax Carbon and Economic Inequality for a Green New Deal — all three elements of which the minority, Republican-controlled Senate now blocks. (Within a day of posting this, we learned that the price of G.O.P. votes for an infrastructure bill that is more highway than climate was to strike funding for new IRS capability to go after billionaire tax cheats.)
Something has to give. We don’t know what. Neither, for that matter, does New York Times columnist Ezra Klein, who, like me, this month devoted a weekend to reading Malm’s book:
To the immediate question — how to force the political system to do enough, fast enough, to avert mass [climate] suffering — I don’t know the answer, or even if there is an answer. Legislative politics is unlikely to suffice under any near-term alignment of power I can foresee.